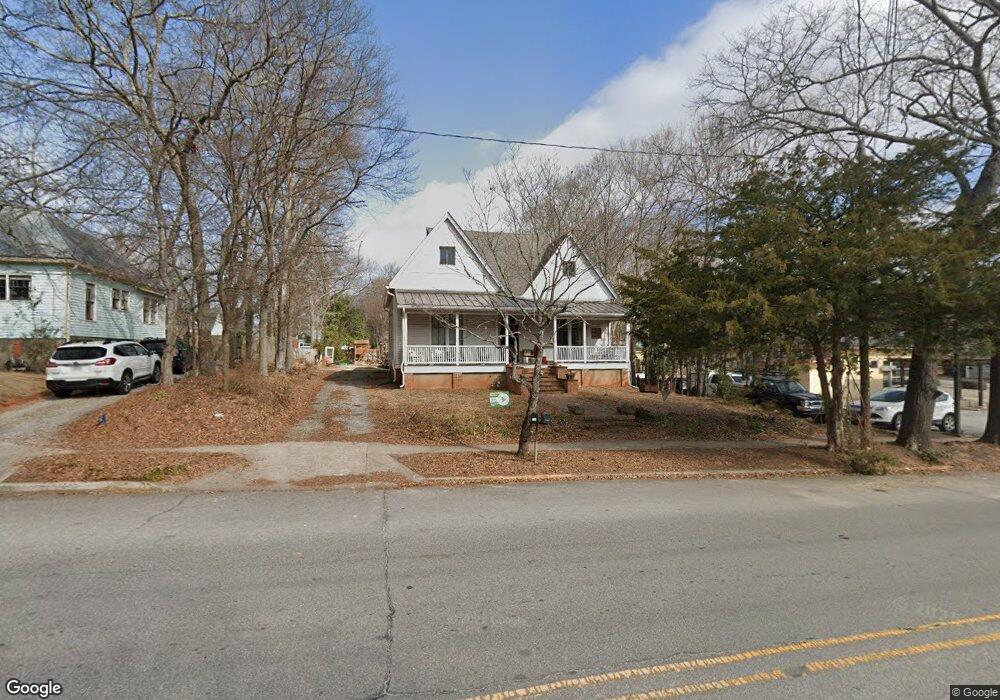
738 Boulevard Athens, GA 30601
Boulevard NeighborhoodEstimated Value: $752,000 - $871,000
Studio
--
Bath
3,010
Sq Ft
$264/Sq Ft
Est. Value
About This Home
This home is located at 738 Boulevard, Athens, GA 30601 and is currently estimated at $796,046, approximately $264 per square foot. 738 Boulevard is a home located in Clarke County with nearby schools including Johnnie Lay Burks Elementary School, Clarke Middle School, and Clarke Central High School.
Ownership History
Date
Name
Owned For
Owner Type
Purchase Details
Closed on
May 16, 2011
Sold by
Old South Investment Enterprises Llc
Bought by
Epting Daniel
Current Estimated Value
Home Financials for this Owner
Home Financials are based on the most recent Mortgage that was taken out on this home.
Original Mortgage
$165,000
Interest Rate
4.92%
Mortgage Type
Future Advance Clause Open End Mortgage
Purchase Details
Closed on
Mar 25, 2011
Sold by
The Pettyjohn Waymon V Inter Vivos
Bought by
Old South Investments Enterprises Llc
Home Financials for this Owner
Home Financials are based on the most recent Mortgage that was taken out on this home.
Original Mortgage
$165,000
Interest Rate
4.92%
Mortgage Type
Future Advance Clause Open End Mortgage
Purchase Details
Closed on
Oct 16, 2003
Sold by
Pettyjohn Waymon V
Bought by
Pettyjohn Waymon V Inter Vivos Trust By
Create a Home Valuation Report for This Property
The Home Valuation Report is an in-depth analysis detailing your home's value as well as a comparison with similar homes in the area
Home Values in the Area
Average Home Value in this Area
Purchase History
| Date | Buyer | Sale Price | Title Company |
|---|---|---|---|
| Epting Daniel | $129,840 | -- | |
| Old South Investments Enterprises Llc | $90,000 | -- | |
| Pettyjohn Waymon V Inter Vivos Trust By | -- | -- |
Source: Public Records
Mortgage History
| Date | Status | Borrower | Loan Amount |
|---|---|---|---|
| Previous Owner | Old South Investments Enterprises Llc | $165,000 |
Source: Public Records
Tax History
| Year | Tax Paid | Tax Assessment Tax Assessment Total Assessment is a certain percentage of the fair market value that is determined by local assessors to be the total taxable value of land and additions on the property. | Land | Improvement |
|---|---|---|---|---|
| 2025 | $6,873 | $245,713 | $54,080 | $191,633 |
| 2024 | $6,873 | $224,332 | $49,920 | $174,412 |
| 2023 | $6,511 | $210,394 | $45,760 | $164,634 |
| 2022 | $5,115 | $170,337 | $45,760 | $124,577 |
| 2021 | $4,827 | $153,227 | $45,760 | $107,467 |
| 2020 | $4,831 | $153,348 | $45,760 | $107,588 |
| 2019 | $3,093 | $101,111 | $41,600 | $59,511 |
| 2018 | $2,553 | $85,200 | $29,200 | $56,000 |
| 2017 | $2,553 | $85,200 | $29,200 | $56,000 |
| 2016 | $2,553 | $85,200 | $29,200 | $56,000 |
| 2015 | $2,557 | $85,200 | $29,200 | $56,000 |
| 2014 | $2,425 | $81,200 | $25,200 | $56,000 |
Source: Public Records
Map
Nearby Homes
- 947 N Chase St
- 552 Cobb St
- 524 Hill St
- 570 Prince Ave
- 923 Hill St
- 390 Athens Ave
- 480 N Billups St
- 271 King Ave
- 159 Sylvia Cir
- 1196 W Hancock Ave Unit 1
- 1198 W West Hancock Ave W
- 668 Pulaski St
- 559 Pulaski St
- 600 Pulaski St
- 100 Prince Ave Unit A404
- 100 Prince Ave Unit A407
- 1226 W Broad St
- 458 Dearing St
- 860 College Ave
- 940 College Ave
- 742 Boulevard
- 815 N Chase St
- 853 N Chase St
- 750 Boulevard
- 533 1/2 Nantahala Ave
- 533 Nantahala Ave
- 863 N Chase St
- 0 N Chase St Unit CM914259
- 0 N Chase St Unit 10256617
- 000 N Chase St
- N N Chase St
- 537 Nantahala Ave
- 739 Boulevard
- 875 N Chase St
- 735 Boulevard
- 541 Nantahala Ave
- 760 Boulevard
- 743 Boulevard
- 545 Nantahala Ave
- 895 N Chase St
Your Personal Tour Guide
Ask me questions while you tour the home.