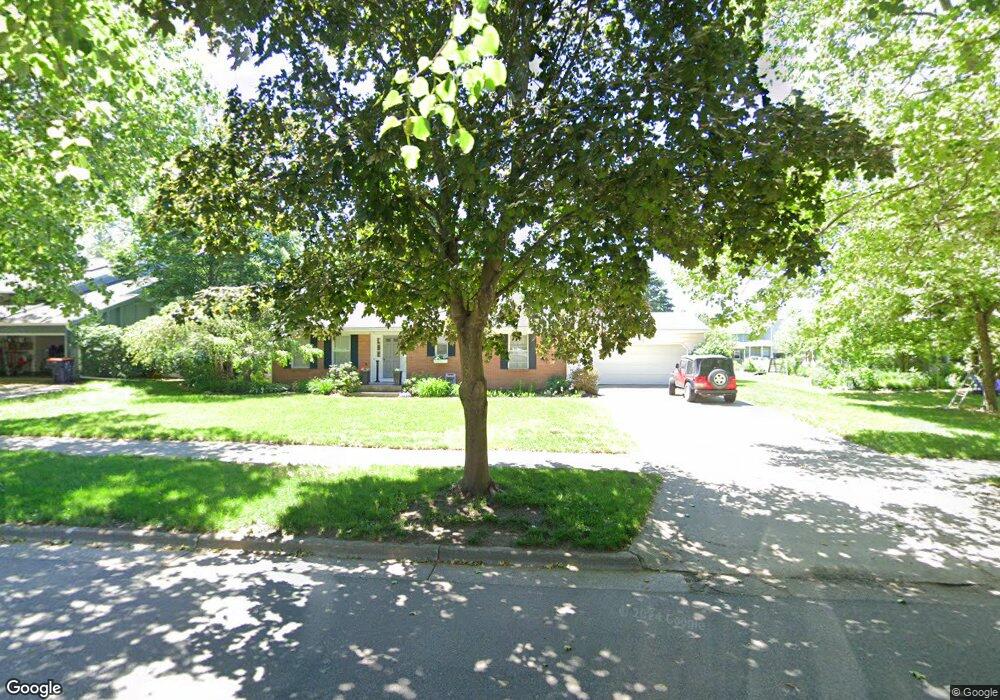
738 Crestview St Holland, MI 49423
Westside NeighborhoodEstimated Value: $340,071 - $440,000
3
Beds
2
Baths
1,954
Sq Ft
$193/Sq Ft
Est. Value
About This Home
This home is located at 738 Crestview St, Holland, MI 49423 and is currently estimated at $377,018, approximately $192 per square foot. 738 Crestview St is a home located in Allegan County with nearby schools including Maplewood, Holland High School, and Pine Ridge Christian School.
Ownership History
Date
Name
Owned For
Owner Type
Purchase Details
Closed on
Aug 15, 2011
Sold by
Boudreau Georgia J
Bought by
Vanloo Julie
Current Estimated Value
Purchase Details
Closed on
May 18, 2007
Sold by
Becksvoort Daniel J and Becksvoort Michelle
Bought by
Georgia J Boudreau Declaration Of Trust
Home Financials for this Owner
Home Financials are based on the most recent Mortgage that was taken out on this home.
Original Mortgage
$125,000
Interest Rate
6.21%
Mortgage Type
New Conventional
Purchase Details
Closed on
Jul 26, 2002
Sold by
Craft Beverly Ann
Bought by
Becksvoort Daniel J
Home Financials for this Owner
Home Financials are based on the most recent Mortgage that was taken out on this home.
Original Mortgage
$104,800
Interest Rate
6.7%
Purchase Details
Closed on
Jul 23, 2001
Sold by
Poll Lillian V
Bought by
Craft Beverly Ann
Purchase Details
Closed on
Sep 4, 1985
Sold by
Poll Harvey J
Create a Home Valuation Report for This Property
The Home Valuation Report is an in-depth analysis detailing your home's value as well as a comparison with similar homes in the area
Home Values in the Area
Average Home Value in this Area
Purchase History
| Date | Buyer | Sale Price | Title Company |
|---|---|---|---|
| Vanloo Julie | $130,500 | Lighthouse Title Inc | |
| Georgia J Boudreau Declaration Of Trust | $165,000 | Chicago Title | |
| Becksvoort Daniel J | $131,000 | -- | |
| Craft Beverly Ann | -- | -- | |
| -- | $74,000 | -- | |
| -- | $74,000 | -- |
Source: Public Records
Mortgage History
| Date | Status | Borrower | Loan Amount |
|---|---|---|---|
| Previous Owner | Georgia J Boudreau Declaration Of Trust | $125,000 | |
| Previous Owner | Becksvoort Daniel J | $104,800 |
Source: Public Records
Tax History
| Year | Tax Paid | Tax Assessment Tax Assessment Total Assessment is a certain percentage of the fair market value that is determined by local assessors to be the total taxable value of land and additions on the property. | Land | Improvement |
|---|---|---|---|---|
| 2025 | $3,183 | $134,100 | $20,900 | $113,200 |
| 2024 | -- | $130,900 | $17,400 | $113,500 |
| 2023 | $2,959 | $106,700 | $17,400 | $89,300 |
| 2022 | $2,825 | $96,100 | $17,400 | $78,700 |
| 2021 | $2,705 | $95,300 | $16,700 | $78,600 |
| 2020 | $2,693 | $91,200 | $16,700 | $74,500 |
| 2019 | $2,564 | $88,400 | $16,700 | $71,700 |
| 2018 | $2,564 | $80,800 | $16,700 | $64,100 |
| 2017 | $0 | $62,600 | $10,000 | $52,600 |
| 2016 | $0 | $62,600 | $10,000 | $52,600 |
| 2015 | -- | $62,600 | $10,000 | $52,600 |
| 2014 | -- | $60,300 | $10,000 | $50,300 |
| 2013 | -- | $56,200 | $10,000 | $46,200 |
Source: Public Records
Map
Nearby Homes
- V/L 60th St
- 699 Brookfield Dr
- 811 Clarewood Ct
- 631 Spring Ln Unit 6
- 897 W 32nd St
- 4709 Dune Grass Ln
- 562 Brookstone St
- 1048 Graystone Rd
- 843 W 25th St
- 6179 Lake Wind Ave Unit Lot 31
- 975 Songbird Ln
- 814 York Ave
- 544 Homestead Ave
- 317 Vista Green Dr
- 301 Vista Green Dr
- 437 Graafschap Rd
- 6243 Woodcliff St
- 6244 62nd St
- 581 S Shore Dr
- 1284 Prestwick Dr
- 748 Crestview St
- 735 Crestview St
- 730 Crestview St
- 762 Crestview St
- 722 Crestview St
- 727 Crestview St
- 4752 Brentwood Ct Unit 15
- 4750 Brentwood Ct
- 4751 Brentwood Ct
- 4748 Brentwood Ct
- 719 Crestview St
- 836 Meadowbrook Ave
- 770 Crestview St
- 714 Crestview St
- 835 Meadowbrook Ave
- 849 Knollcrest Ave
- 4749 Brentwood Ct
- 4746 Brentwood Ct
- 711 Crestview St
- 841 Knollcrest Ave
Your Personal Tour Guide
Ask me questions while you tour the home.