Estimated Value: $107,000 - $150,176
4
Beds
2
Baths
1,694
Sq Ft
$74/Sq Ft
Est. Value
About This Home
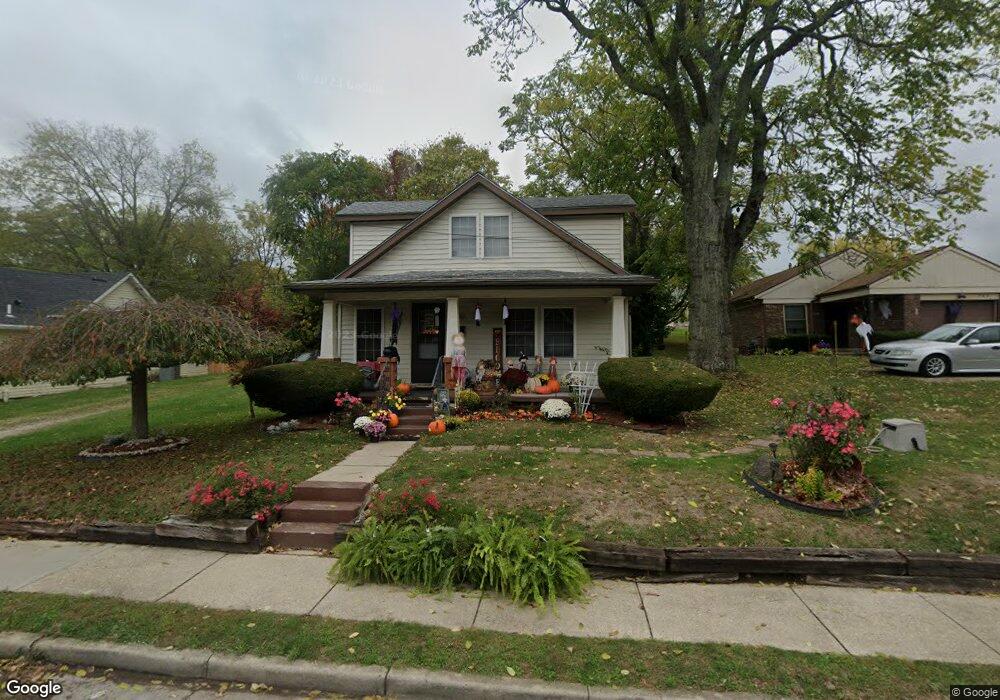
This home is located at 738 E 3rd St, Xenia, OH 45385 and is currently estimated at $124,544, approximately $73 per square foot. 738 E 3rd St is a home located in Greene County with nearby schools including Xenia High School, Summit Academy Community School for Alternative Learners - Xenia, and Legacy Christian Academy.
Ownership History
Date
Name
Owned For
Owner Type
Purchase Details
Closed on
Aug 11, 2023
Sold by
738 E Third Llc
Bought by
738 E Third St Trust and Dexter
Current Estimated Value
Purchase Details
Closed on
Mar 29, 2022
Sold by
Lenyk and Wei
Bought by
738 E Third Llc
Purchase Details
Closed on
Jan 6, 2022
Sold by
Pollyanna Properties Llc
Bought by
Lenyk Christopher A
Home Financials for this Owner
Home Financials are based on the most recent Mortgage that was taken out on this home.
Original Mortgage
$68,360
Interest Rate
3.11%
Mortgage Type
New Conventional
Purchase Details
Closed on
Feb 10, 2003
Sold by
Weston Rubin F and Weston Elisabeth H
Bought by
Jongoma Llc
Create a Home Valuation Report for This Property
The Home Valuation Report is an in-depth analysis detailing your home's value as well as a comparison with similar homes in the area
Home Values in the Area
Average Home Value in this Area
Purchase History
| Date | Buyer | Sale Price | Title Company |
|---|---|---|---|
| 738 E Third St Trust | -- | None Listed On Document | |
| 738 E Third Llc | -- | None Listed On Document | |
| Lenyk Christopher A | -- | Hedrick & Jordan Co Lpa | |
| Jongoma Llc | -- | -- |
Source: Public Records
Mortgage History
| Date | Status | Borrower | Loan Amount |
|---|---|---|---|
| Previous Owner | Lenyk Christopher A | $68,360 |
Source: Public Records
Tax History
| Year | Tax Paid | Tax Assessment Tax Assessment Total Assessment is a certain percentage of the fair market value that is determined by local assessors to be the total taxable value of land and additions on the property. | Land | Improvement |
|---|---|---|---|---|
| 2025 | $1,389 | $31,900 | $2,530 | $29,370 |
| 2024 | $1,389 | $31,900 | $2,530 | $29,370 |
| 2023 | $1,365 | $31,900 | $2,530 | $29,370 |
| 2022 | $901 | $17,960 | $2,300 | $15,660 |
| 2021 | $913 | $17,960 | $2,300 | $15,660 |
| 2020 | $875 | $17,960 | $2,300 | $15,660 |
| 2019 | $814 | $15,730 | $2,410 | $13,320 |
| 2018 | $817 | $15,730 | $2,410 | $13,320 |
| 2017 | $794 | $15,730 | $2,410 | $13,320 |
| 2016 | $802 | $15,140 | $2,410 | $12,730 |
| 2015 | $804 | $15,140 | $2,410 | $12,730 |
| 2014 | $770 | $15,140 | $2,410 | $12,730 |
Source: Public Records
Map
Nearby Homes
Your Personal Tour Guide
Ask me questions while you tour the home.