738 E 4th Ave Kennewick, WA 99336
Estimated Value: $271,667 - $330,000
2
Beds
1
Bath
1,076
Sq Ft
$276/Sq Ft
Est. Value
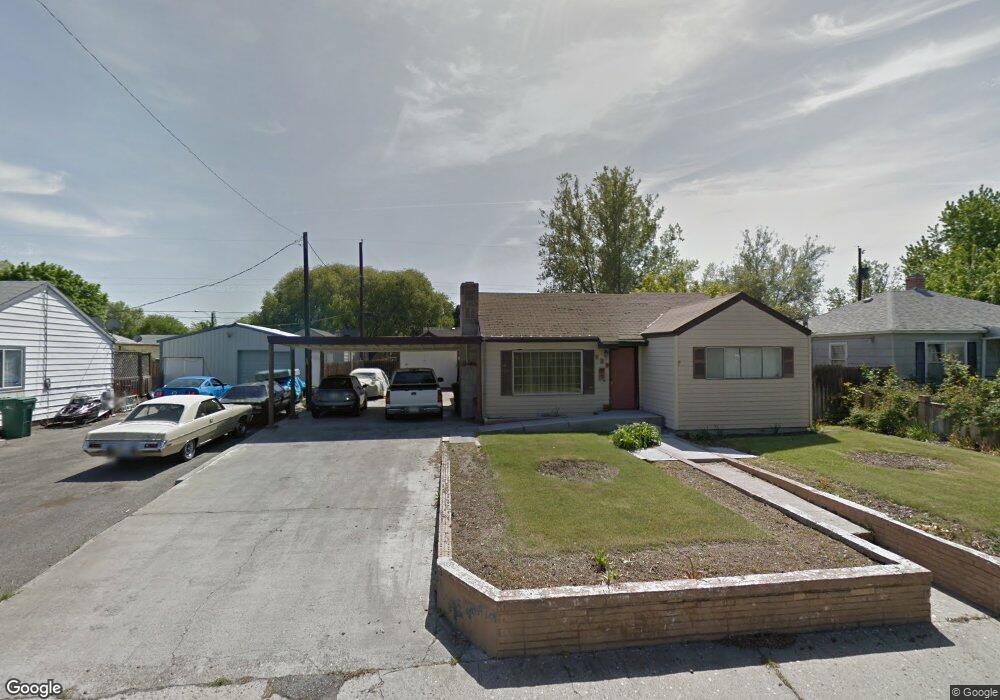
About This Home
This home is located at 738 E 4th Ave, Kennewick, WA 99336 and is currently estimated at $296,917, approximately $275 per square foot. 738 E 4th Ave is a home located in Benton County with nearby schools including Eastgate Elementary School, Horse Heaven Hills Middle School, and Kennewick High School.
Ownership History
Date
Name
Owned For
Owner Type
Purchase Details
Closed on
Jan 20, 2010
Sold by
Hsbc Mortgage Services Inc
Bought by
Watson Trevor J
Current Estimated Value
Home Financials for this Owner
Home Financials are based on the most recent Mortgage that was taken out on this home.
Original Mortgage
$10,000
Outstanding Balance
$8,372
Interest Rate
12%
Mortgage Type
Stand Alone Second
Estimated Equity
$288,545
Purchase Details
Closed on
Nov 13, 2009
Sold by
Shaw Clifford G and Shaw Lorna J
Bought by
Hsbc Mortgage Services Inc
Create a Home Valuation Report for This Property
The Home Valuation Report is an in-depth analysis detailing your home's value as well as a comparison with similar homes in the area
Purchase History
| Date | Buyer | Sale Price | Title Company |
|---|---|---|---|
| Watson Trevor J | $85,900 | Chicago Title | |
| Hsbc Mortgage Services Inc | $50,374 | Accommodation |
Source: Public Records
Mortgage History
| Date | Status | Borrower | Loan Amount |
|---|---|---|---|
| Open | Watson Trevor J | $10,000 | |
| Open | Watson Trevor J | $74,684 |
Source: Public Records
Tax History
| Year | Tax Paid | Tax Assessment Tax Assessment Total Assessment is a certain percentage of the fair market value that is determined by local assessors to be the total taxable value of land and additions on the property. | Land | Improvement |
|---|---|---|---|---|
| 2025 | $2,095 | $227,330 | $70,000 | $157,330 |
| 2024 | $1,952 | $217,500 | $70,000 | $147,500 |
| 2023 | $1,952 | $202,750 | $70,000 | $132,750 |
| 2022 | $1,770 | $168,330 | $70,000 | $98,330 |
| 2021 | $1,600 | $151,680 | $40,000 | $111,680 |
| 2020 | $1,615 | $133,680 | $22,000 | $111,680 |
| 2019 | $1,492 | $129,950 | $22,000 | $107,950 |
| 2018 | $1,433 | $122,510 | $22,000 | $100,510 |
| 2017 | $1,314 | $96,450 | $22,000 | $74,450 |
| 2016 | $1,362 | $96,450 | $22,000 | $74,450 |
| 2015 | $1,313 | $98,880 | $22,000 | $76,880 |
| 2014 | -- | $94,100 | $22,000 | $72,100 |
| 2013 | -- | $94,100 | $22,000 | $72,100 |
Source: Public Records
Map
Nearby Homes
- 408 S Gum St
- 501 S Fir St
- 406 S Fir St
- 909 S Gum St
- NKA Washington 397
- 608 E 8th Ave
- 837 S Hawthorne St
- 900 S Gum St
- 229 E 5th Ave
- 3 N Gum St
- 218 E 8th Place
- 1526 E 3rd Ave
- 706 S Alder St
- 1421 S Cedar St Unit 8
- 1421 S Cedar St
- 1421 S Cedar #82 St
- 11 W 2nd Ave
- 2804 S Beech St Unit Lot 8
- 17 E 13th Ave
- 2731 S Alder St
Your Personal Tour Guide
Ask me questions while you tour the home.