738 Edison St Geneva, IL 60134
Northwest Central Geneva NeighborhoodEstimated Value: $348,206 - $409,000
3
Beds
1
Bath
1,278
Sq Ft
$289/Sq Ft
Est. Value
About This Home
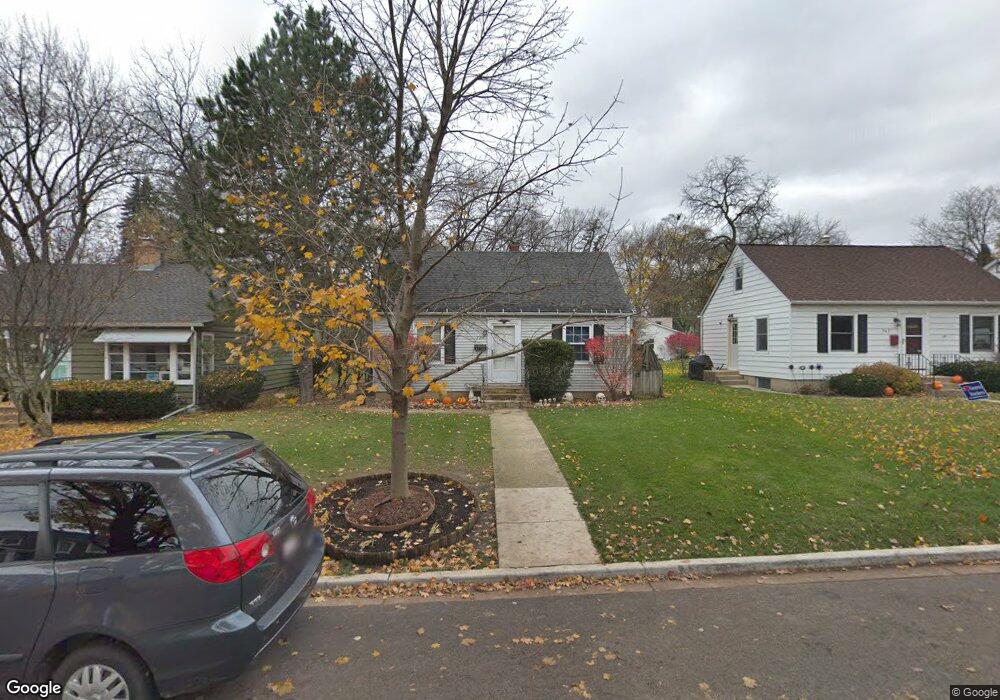
This home is located at 738 Edison St, Geneva, IL 60134 and is currently estimated at $368,802, approximately $288 per square foot. 738 Edison St is a home located in Kane County with nearby schools including Williamsburg Elementary School, Geneva Middle School North, and Geneva Middle School South.
Ownership History
Date
Name
Owned For
Owner Type
Purchase Details
Closed on
Nov 30, 1995
Sold by
Chatfield Glenne and Chatfield Jill L T
Bought by
Miller John D and Miller Gina L
Current Estimated Value
Home Financials for this Owner
Home Financials are based on the most recent Mortgage that was taken out on this home.
Original Mortgage
$132,873
Outstanding Balance
$2,737
Interest Rate
7.44%
Mortgage Type
FHA
Estimated Equity
$366,065
Create a Home Valuation Report for This Property
The Home Valuation Report is an in-depth analysis detailing your home's value as well as a comparison with similar homes in the area
Home Values in the Area
Average Home Value in this Area
Purchase History
We collect this data history from publicly available records. To have your information removed, we recommend requesting removal directly through your county’s website.
| Date | Buyer | Sale Price | Title Company |
|---|---|---|---|
| Miller John D | $137,000 | Fox Title Company |
Source: Public Records
Mortgage History
We collect this data history from publicly available records. To have your information removed, we recommend requesting removal directly through your county’s website.
| Date | Status | Borrower | Loan Amount |
|---|---|---|---|
| Open | Miller John D | $132,873 |
Source: Public Records
Tax History
| Year | Tax Paid | Tax Assessment Tax Assessment Total Assessment is a certain percentage of the fair market value that is determined by local assessors to be the total taxable value of land and additions on the property. | Land | Improvement |
|---|---|---|---|---|
| 2024 | $6,270 | $90,397 | $35,954 | $54,443 |
| 2023 | $6,086 | $82,179 | $32,685 | $49,494 |
| 2022 | $6,172 | $79,915 | $30,371 | $49,544 |
| 2021 | $5,983 | $76,945 | $29,242 | $47,703 |
| 2020 | $5,912 | $75,771 | $28,796 | $46,975 |
| 2019 | $5,892 | $74,337 | $28,251 | $46,086 |
| 2018 | $5,716 | $72,382 | $28,251 | $44,131 |
| 2017 | $5,646 | $70,452 | $27,498 | $42,954 |
| 2016 | $5,671 | $69,499 | $27,126 | $42,373 |
| 2015 | -- | $66,076 | $25,790 | $40,286 |
| 2014 | -- | $65,286 | $25,790 | $39,496 |
| 2013 | -- | $65,286 | $25,790 | $39,496 |
Source: Public Records
Map
Nearby Homes
- 622 Edison St
- 82 Gray St
- 95 Roosevelt St
- 518 Illinois St
- 67 White Oak Cir
- 321 N 6th St
- 728 N Lincoln Ave
- 101 Horne St
- 842 N Bennett St
- 1028 S 4th St
- Lot 2 Geneva Rd
- Lot 1 Geneva Rd
- 885 Geneva Rd
- 16 Mosedale St
- 712 Westfield Dr
- 200 N River Ln Unit 101
- 938 S 5th St
- 807 Viewpointe Dr
- 11 Logan Ave
- 1501 North St
Your Personal Tour Guide
Ask me questions while you tour the home.