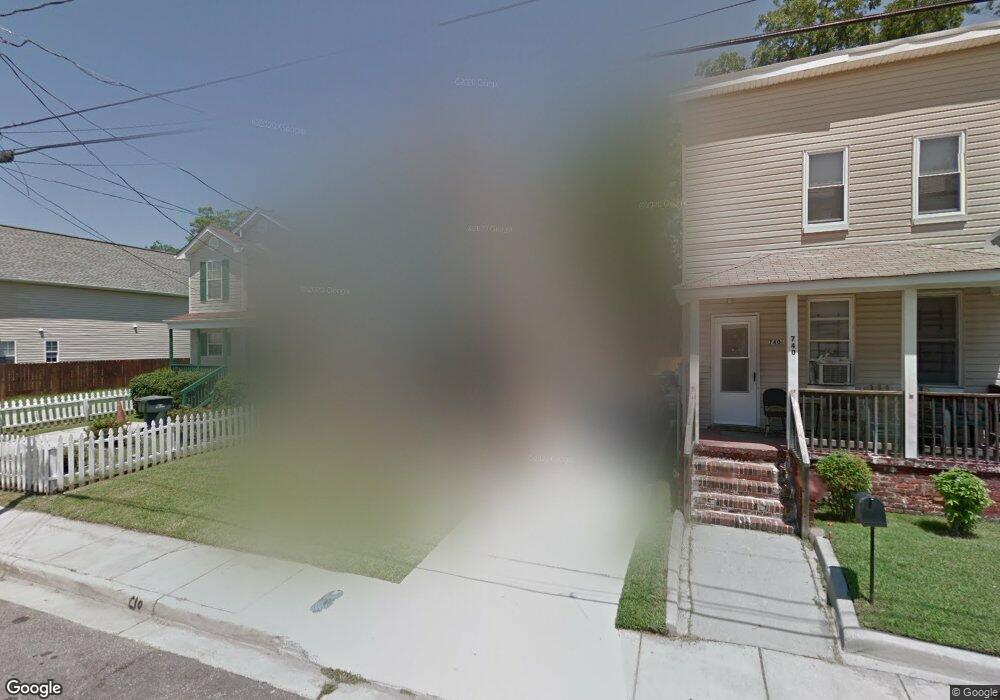
738 Fremont St Norfolk, VA 23504
Olde Huntersville NeighborhoodEstimated Value: $295,057 - $305,000
3
Beds
3
Baths
1,780
Sq Ft
$169/Sq Ft
Est. Value
About This Home
This home is located at 738 Fremont St, Norfolk, VA 23504 and is currently estimated at $300,514, approximately $168 per square foot. 738 Fremont St is a home located in Norfolk City with nearby schools including P.B. Young Sr. Elementary School, Tidewater Park Elementary School, and Blair Middle School.
Ownership History
Date
Name
Owned For
Owner Type
Purchase Details
Closed on
Apr 22, 2015
Sold by
Young Ywain
Bought by
Smith Lesmore and Smith Tasha Baron
Current Estimated Value
Home Financials for this Owner
Home Financials are based on the most recent Mortgage that was taken out on this home.
Original Mortgage
$181,827
Outstanding Balance
$140,582
Interest Rate
3.86%
Mortgage Type
VA
Estimated Equity
$159,932
Create a Home Valuation Report for This Property
The Home Valuation Report is an in-depth analysis detailing your home's value as well as a comparison with similar homes in the area
Home Values in the Area
Average Home Value in this Area
Purchase History
| Date | Buyer | Sale Price | Title Company |
|---|---|---|---|
| Smith Lesmore | $178,000 | Attorney |
Source: Public Records
Mortgage History
| Date | Status | Borrower | Loan Amount |
|---|---|---|---|
| Open | Smith Lesmore | $181,827 |
Source: Public Records
Tax History Compared to Growth
Tax History
| Year | Tax Paid | Tax Assessment Tax Assessment Total Assessment is a certain percentage of the fair market value that is determined by local assessors to be the total taxable value of land and additions on the property. | Land | Improvement |
|---|---|---|---|---|
| 2025 | $3,593 | $287,400 | $29,500 | $257,900 |
| 2024 | $3,299 | $268,200 | $29,500 | $238,700 |
| 2023 | $3,196 | $255,700 | $29,500 | $226,200 |
| 2022 | $2,849 | $227,900 | $20,400 | $207,500 |
| 2021 | $2,503 | $200,200 | $14,500 | $185,700 |
| 2020 | $2,503 | $200,200 | $14,500 | $185,700 |
| 2019 | $2,216 | $177,300 | $14,500 | $162,800 |
| 2018 | $2,074 | $165,900 | $14,500 | $151,400 |
| 2017 | $1,906 | $165,700 | $14,500 | $151,200 |
| 2016 | $1,864 | $14,500 | $14,500 | $0 |
| 2015 | $167 | $14,500 | $14,500 | $0 |
| 2014 | $167 | $14,500 | $14,500 | $0 |
Source: Public Records
Map
Nearby Homes