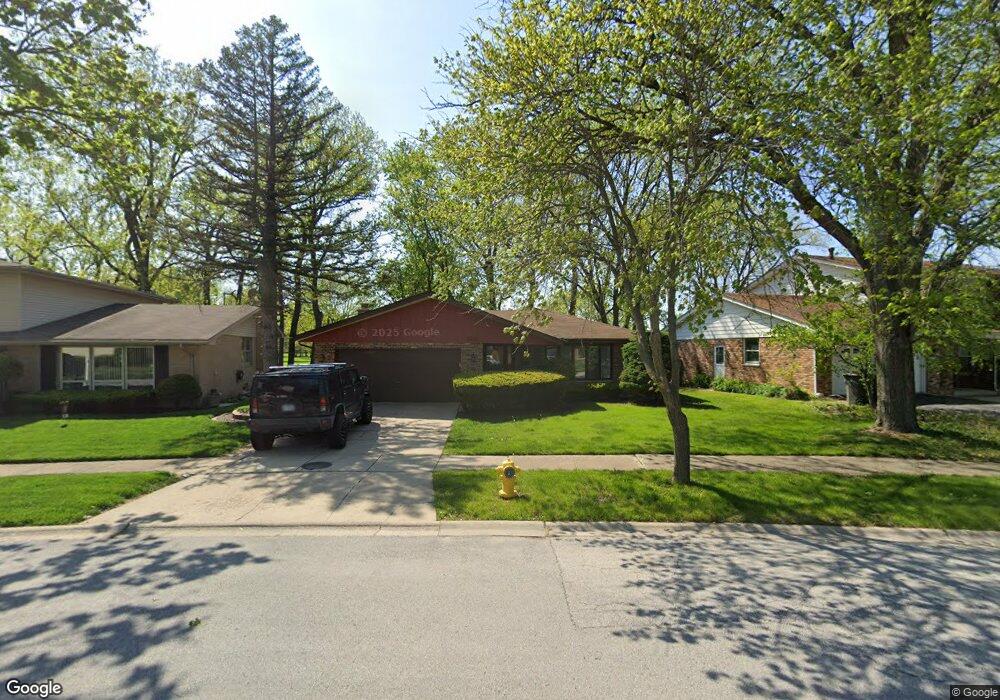
738 Kostner Ave Matteson, IL 60443
Old Matteson NeighborhoodEstimated Value: $257,000 - $304,000
3
Beds
3
Baths
1,726
Sq Ft
$162/Sq Ft
Est. Value
About This Home
This home is located at 738 Kostner Ave, Matteson, IL 60443 and is currently estimated at $280,307, approximately $162 per square foot. 738 Kostner Ave is a home located in Cook County with nearby schools including Illinois School, Arcadia Elementary School, and Indiana Elementary School.
Ownership History
Date
Name
Owned For
Owner Type
Purchase Details
Closed on
Aug 27, 2021
Sold by
Taylor Bobby L and Taylor Tyra A
Bought by
Pugh Kozetta
Current Estimated Value
Home Financials for this Owner
Home Financials are based on the most recent Mortgage that was taken out on this home.
Original Mortgage
$171,950
Outstanding Balance
$156,899
Interest Rate
2.99%
Mortgage Type
New Conventional
Estimated Equity
$123,408
Purchase Details
Closed on
Jul 25, 2006
Sold by
Dale Tyra A and Taylor Tyra A
Bought by
Taylor Bobby L and Taylor Tyra A
Home Financials for this Owner
Home Financials are based on the most recent Mortgage that was taken out on this home.
Original Mortgage
$170,400
Interest Rate
9%
Mortgage Type
Unknown
Purchase Details
Closed on
Sep 14, 2000
Sold by
Graham Dale K and Graham Frances L
Bought by
Dale Tyra A
Home Financials for this Owner
Home Financials are based on the most recent Mortgage that was taken out on this home.
Original Mortgage
$125,250
Interest Rate
8.67%
Create a Home Valuation Report for This Property
The Home Valuation Report is an in-depth analysis detailing your home's value as well as a comparison with similar homes in the area
Home Values in the Area
Average Home Value in this Area
Purchase History
| Date | Buyer | Sale Price | Title Company |
|---|---|---|---|
| Pugh Kozetta | $181,000 | Chicago Title Insurance Co | |
| Taylor Bobby L | -- | Netco | |
| Dale Tyra A | $167,000 | Professional National Title |
Source: Public Records
Mortgage History
| Date | Status | Borrower | Loan Amount |
|---|---|---|---|
| Open | Pugh Kozetta | $171,950 | |
| Previous Owner | Taylor Bobby L | $170,400 | |
| Previous Owner | Dale Tyra A | $125,250 | |
| Closed | Dale Tyra A | $33,400 |
Source: Public Records
Tax History Compared to Growth
Tax History
| Year | Tax Paid | Tax Assessment Tax Assessment Total Assessment is a certain percentage of the fair market value that is determined by local assessors to be the total taxable value of land and additions on the property. | Land | Improvement |
|---|---|---|---|---|
| 2024 | $8,549 | $24,000 | $3,242 | $20,758 |
| 2023 | $5,892 | $24,000 | $3,242 | $20,758 |
| 2022 | $5,892 | $14,280 | $2,836 | $11,444 |
| 2021 | $6,022 | $14,280 | $2,836 | $11,444 |
| 2020 | $5,693 | $14,280 | $2,836 | $11,444 |
| 2019 | $6,474 | $15,939 | $2,633 | $13,306 |
| 2018 | $6,470 | $15,939 | $2,633 | $13,306 |
| 2017 | $6,241 | $15,939 | $2,633 | $13,306 |
| 2016 | $5,990 | $14,680 | $2,431 | $12,249 |
| 2015 | $5,877 | $14,680 | $2,431 | $12,249 |
| 2014 | $5,719 | $14,680 | $2,431 | $12,249 |
| 2013 | $5,814 | $16,099 | $2,431 | $13,668 |
Source: Public Records
Map
Nearby Homes
- 4325 Oakwood Ln
- 4329 Applewood Ln
- 820 School Ave
- 663 Primrose Ln
- 4228 Applewood Ln
- 4335 Lindenwood Dr
- 706 Carnation Ln
- 858 Academy Ave
- 4110 Applewood Ln
- 4108 Applewood Ln
- 4613 Lindenwood Ct
- 831 Violet Ln
- 20520 Crawford Ave
- 820 Exmoor Rd
- 4500 203rd St
- 4200 Washington Ave
- 20340 Crawford Ave
- 312 Grafton Place
- 4700 203rd St
- 20920 Governors Hwy
- 732 Kostner Ave
- 728 Kostner Ave
- 739 Kostner Ave
- 800 Kostner Ave
- 4336 Cedarwood Ln
- 724 Kostner Ave
- 733 Kostner Ave Unit 2
- 806 Kostner Ave
- 722 Kostner Ave
- 4330 Cedarwood Ln Unit 2
- 727 Kostner Ave
- 718 Kostner Ave
- 714 Kostner Ave
- 810 Kostner Ave
- 809 Kostner Ave
- 4324 Cedarwood Ln
- 721 Kostner Ave
- 712 Kostner Ave
- 4331 Cedarwood Ln
- 816 Kostner Ave