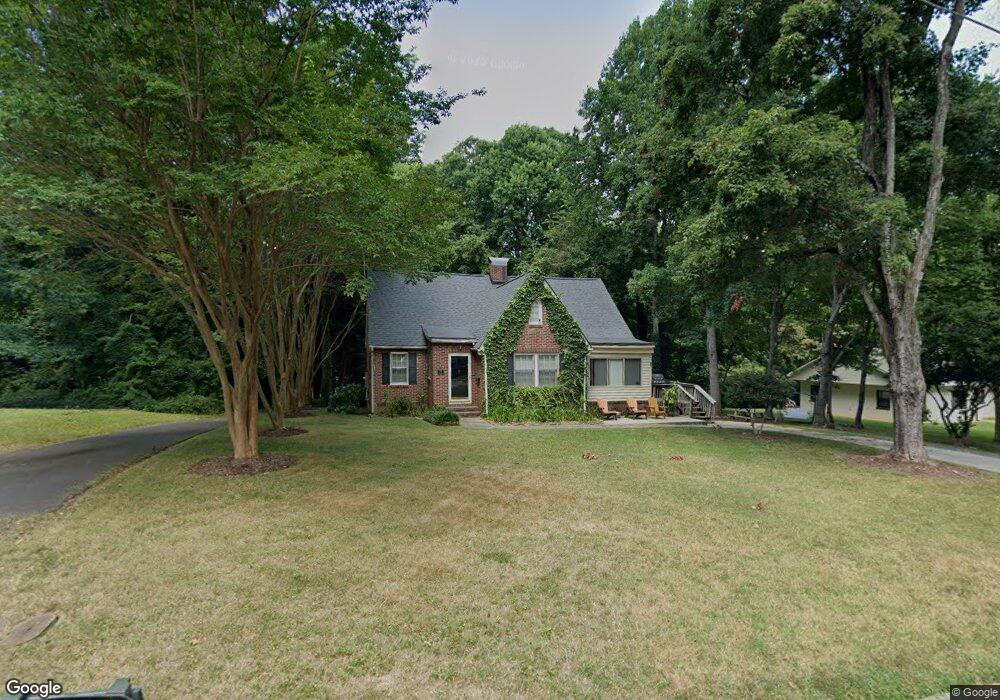
738 Lee St Asheboro, NC 27203
Estimated Value: $255,973 - $264,000
About This Home
This home is located at 738 Lee St, Asheboro, NC 27203 and is currently estimated at $259,493, approximately $130 per square foot. 738 Lee St is a home located in Randolph County with nearby schools including Donna L. Loflin Elementary School, South Asheboro Middle School, and Asheboro High School.
Ownership History
We collect this data history from publicly available records. To have your information removed, we recommend requesting removal directly through your county’s website.
Purchase Details
Home Financials for this Owner
Home Financials are based on the most recent Mortgage that was taken out on this home.Purchase Details
Home Values in the Area
Average Home Value in this Area
Purchase History
We collect this data history from publicly available records. To have your information removed, we recommend requesting removal directly through your county’s website.
| Date | Buyer | Sale Price | Title Company |
|---|---|---|---|
| $142,000 | None Available | ||
| $58,000 | -- |
Mortgage History
We collect this data history from publicly available records. To have your information removed, we recommend requesting removal directly through your county’s website.
| Date | Status | Borrower | Loan Amount |
|---|---|---|---|
| Open | $137,667 |
Tax History
We collect this data history from publicly available records. To have your information removed, we recommend requesting removal directly through your county’s website.
| Year | Tax Paid | Tax Assessment Tax Assessment Total Assessment is a certain percentage of the fair market value that is determined by local assessors to be the total taxable value of land and additions on the property. | Land | Improvement |
|---|---|---|---|---|
| 2025 | $2,600 | $196,150 | $32,010 | $164,140 |
| 2024 | $2,600 | $196,150 | $32,010 | $164,140 |
| 2023 | $2,600 | $196,150 | $32,010 | $164,140 |
| 2022 | $2,016 | $139,870 | $18,670 | $121,200 |
| 2021 | $2,016 | $139,870 | $18,670 | $121,200 |
| 2020 | $1,705 | $118,300 | $18,670 | $99,630 |
| 2019 | $1,705 | $118,300 | $18,670 | $99,630 |
| 2018 | $1,436 | $97,870 | $21,030 | $76,840 |
| 2016 | $1,436 | $97,865 | $21,030 | $76,835 |
| 2015 | $1,439 | $97,865 | $21,030 | $76,835 |
| 2014 | $1,404 | $97,865 | $21,030 | $76,835 |
Map
- 855 Lee St
- 515 Spencer Ave
- 202 Armfield Ave
- 889 Berg St
- 859 Berg St
- 799 William Ave
- 135 Dixon St
- 716 Dixon Ave Unit A
- 826 Dixon Ave
- 725 S Main St Unit 2A
- 127 E Walker Ave
- 163 E Academy St
- 130 West St
- 320 Lindley Ave
- 822 Glenwood Rd
- 331 Railroad St
- 950 Cliff Rd
- 0 Oakhurst Dr
- 421 Summit Ave
- 131 Whitley St
Ask me questions while you tour the home.