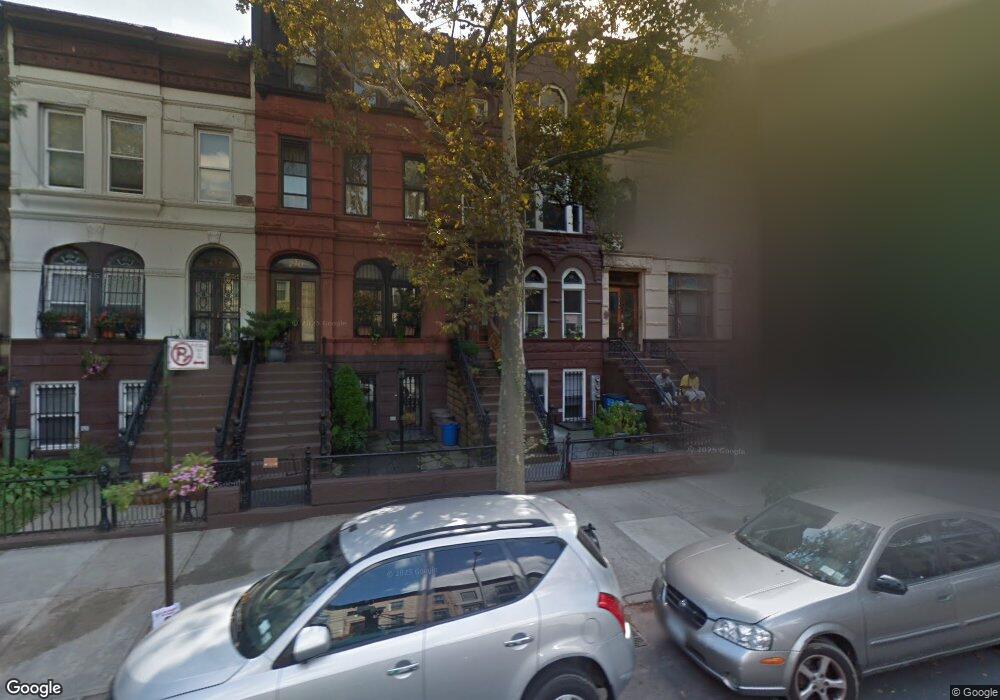
738 Macon St Brooklyn, NY 11233
Bed-Stuy NeighborhoodEstimated Value: $1,772,000 - $2,193,000
6
Beds
3
Baths
3,240
Sq Ft
$602/Sq Ft
Est. Value
About This Home
This home is located at 738 Macon St, Brooklyn, NY 11233 and is currently estimated at $1,950,051, approximately $601 per square foot. 738 Macon St is a home located in Kings County with nearby schools including P.S. 5 Dr Ronald Mcnair, Uncommon Excellence Boys Elementary School and Middle School, and Excellence Girls Charter School.
Ownership History
Date
Name
Owned For
Owner Type
Purchase Details
Closed on
Mar 9, 2022
Sold by
Hartig Brian J
Bought by
Hartig Brian J and Schmidt Arthur Chester
Current Estimated Value
Home Financials for this Owner
Home Financials are based on the most recent Mortgage that was taken out on this home.
Original Mortgage
$503,847
Outstanding Balance
$469,899
Interest Rate
3.76%
Mortgage Type
Purchase Money Mortgage
Estimated Equity
$1,480,152
Purchase Details
Closed on
Oct 6, 2010
Sold by
Secured Equity Advantage Llc
Bought by
Hartig Brian
Home Financials for this Owner
Home Financials are based on the most recent Mortgage that was taken out on this home.
Original Mortgage
$510,750
Interest Rate
4.36%
Mortgage Type
Purchase Money Mortgage
Purchase Details
Closed on
May 12, 2010
Sold by
Andrews Joseph
Bought by
Secured Equity Advantage Llc
Purchase Details
Closed on
Aug 22, 2008
Sold by
Andrews Joseph
Bought by
Andrews Joseph and Gaskin Aaron
Create a Home Valuation Report for This Property
The Home Valuation Report is an in-depth analysis detailing your home's value as well as a comparison with similar homes in the area
Home Values in the Area
Average Home Value in this Area
Purchase History
| Date | Buyer | Sale Price | Title Company |
|---|---|---|---|
| Hartig Brian J | -- | -- | |
| Hartig Brian | $520,000 | -- | |
| Secured Equity Advantage Llc | $499,000 | -- | |
| Andrews Joseph | -- | -- |
Source: Public Records
Mortgage History
| Date | Status | Borrower | Loan Amount |
|---|---|---|---|
| Open | Hartig Brian J | $503,847 | |
| Closed | Hartig Brian | $510,750 |
Source: Public Records
Tax History Compared to Growth
Tax History
| Year | Tax Paid | Tax Assessment Tax Assessment Total Assessment is a certain percentage of the fair market value that is determined by local assessors to be the total taxable value of land and additions on the property. | Land | Improvement |
|---|---|---|---|---|
| 2025 | $4,932 | $92,940 | $21,960 | $70,980 |
| 2024 | $4,932 | $109,320 | $21,960 | $87,360 |
| 2023 | $4,758 | $115,020 | $21,960 | $93,060 |
| 2022 | $4,162 | $103,800 | $21,960 | $81,840 |
| 2021 | $4,206 | $97,980 | $21,960 | $76,020 |
| 2020 | $2,089 | $96,660 | $21,960 | $74,700 |
| 2019 | $3,874 | $84,300 | $21,960 | $62,340 |
| 2018 | $3,544 | $23,644 | $8,164 | $15,480 |
| 2017 | $3,821 | $22,572 | $6,287 | $16,285 |
| 2016 | $3,592 | $21,825 | $7,763 | $14,062 |
| 2015 | $2,115 | $21,819 | $11,654 | $10,165 |
| 2014 | $2,115 | $20,601 | $13,204 | $7,397 |
Source: Public Records
Map
Nearby Homes
- 635 Macdonough St
- 761 Macon St
- 816 Halsey St
- 830 Halsey St Unit 1A
- 608 Macdonough St
- 547 Decatur St
- 784 Halsey St
- 529 Decatur St
- 521 Decatur St
- 524 Decatur St
- 707 Macon St
- 794 Macon St
- 768 Halsey St
- 571 Macdonough St Unit 1
- 571 Macdonough St Unit 3
- 571 Macdonough St Unit 2
- 397 Bainbridge St
- 576 Decatur St
- 686 Macdonough St Unit 3A
- 605 Decatur St
- 740 Macon St
- 740 Macon St
- 740 Macon St
- 740 Macon St
- 740 Macon St Unit House
- 736 Macon St
- 742 Macon St
- 734 Macon St
- 734 Macon St Unit DUPLEX
- 734 Macon St Unit PARLOR
- 734 Macon St Unit 1
- 734 Macon St Unit 3
- 734 Macon St Unit 2
- 744 Macon St
- 732 Macon St
- 746 Macon St
- 746 Macon St Unit 3
- 730A Macon St
- 730A Macon St Unit Building
- 748 Macon St