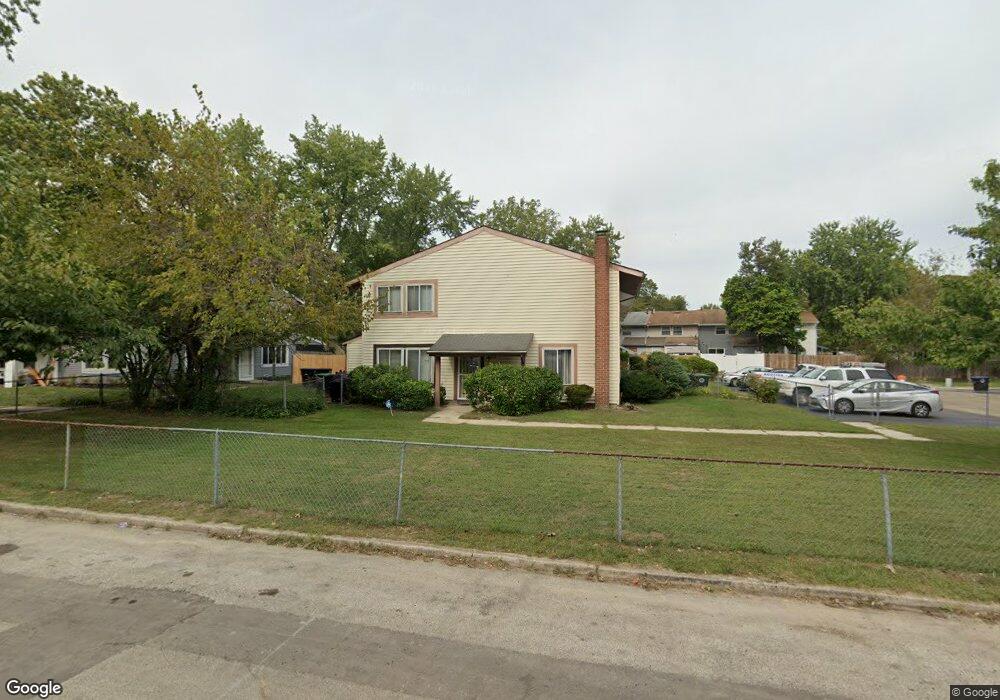
738 Myrtle Ave Lindenwold, NJ 08021
Estimated Value: $181,074 - $223,000
--
Bed
--
Bath
1,400
Sq Ft
$149/Sq Ft
Est. Value
About This Home
This home is located at 738 Myrtle Ave, Lindenwold, NJ 08021 and is currently estimated at $209,019, approximately $149 per square foot. 738 Myrtle Ave is a home located in Camden County with nearby schools including Memorial Middle School, Lindenwold High School, and South Jersey Sudbury School.
Ownership History
Date
Name
Owned For
Owner Type
Purchase Details
Closed on
Feb 25, 2008
Sold by
Rivers Mark and Rivers Victoria
Bought by
Rivers Mark and Rivers Victoria
Current Estimated Value
Home Financials for this Owner
Home Financials are based on the most recent Mortgage that was taken out on this home.
Original Mortgage
$104,545
Outstanding Balance
$67,062
Interest Rate
6.3%
Mortgage Type
FHA
Estimated Equity
$141,957
Purchase Details
Closed on
Dec 3, 2007
Sold by
Rivers Mark and Rivers Victoria
Bought by
Rivers Mark and Rivers Victoria
Home Financials for this Owner
Home Financials are based on the most recent Mortgage that was taken out on this home.
Original Mortgage
$104,545
Interest Rate
6.3%
Mortgage Type
FHA
Purchase Details
Closed on
Aug 13, 2002
Sold by
Patnaik Pradyot
Bought by
Rivers Mark
Home Financials for this Owner
Home Financials are based on the most recent Mortgage that was taken out on this home.
Original Mortgage
$68,918
Interest Rate
6.11%
Mortgage Type
FHA
Create a Home Valuation Report for This Property
The Home Valuation Report is an in-depth analysis detailing your home's value as well as a comparison with similar homes in the area
Home Values in the Area
Average Home Value in this Area
Purchase History
| Date | Buyer | Sale Price | Title Company |
|---|---|---|---|
| Rivers Mark | -- | -- | |
| Rivers Mark | -- | -- | |
| Rivers Mark | $70,000 | -- |
Source: Public Records
Mortgage History
| Date | Status | Borrower | Loan Amount |
|---|---|---|---|
| Open | Rivers Mark | $104,545 | |
| Previous Owner | Rivers Mark | $104,545 | |
| Previous Owner | Rivers Mark | $68,918 |
Source: Public Records
Tax History Compared to Growth
Tax History
| Year | Tax Paid | Tax Assessment Tax Assessment Total Assessment is a certain percentage of the fair market value that is determined by local assessors to be the total taxable value of land and additions on the property. | Land | Improvement |
|---|---|---|---|---|
| 2025 | $3,709 | $75,000 | $28,000 | $47,000 |
| 2024 | $3,729 | $75,000 | $28,000 | $47,000 |
| 2023 | $3,729 | $75,000 | $28,000 | $47,000 |
| 2022 | $3,725 | $75,000 | $28,000 | $47,000 |
| 2021 | $3,828 | $75,000 | $28,000 | $47,000 |
| 2020 | $3,806 | $75,000 | $28,000 | $47,000 |
| 2019 | $3,839 | $75,000 | $28,000 | $47,000 |
| 2018 | $3,830 | $75,000 | $28,000 | $47,000 |
| 2017 | $3,715 | $75,000 | $28,000 | $47,000 |
| 2016 | $3,632 | $75,000 | $28,000 | $47,000 |
| 2015 | $3,479 | $75,000 | $28,000 | $47,000 |
| 2014 | $3,327 | $75,000 | $28,000 | $47,000 |
Source: Public Records
Map
Nearby Homes
- 805 Myrtle Ave
- 713 Myrtle Ave
- 725 E Linden Ave
- 450 Hawthorne St
- 409 Cedar Ave
- 470 Wilson Ave
- 961 - E Gibbsboro Rd
- 700 Elizabeth Ave
- 919 Pinelawn Ave
- 201 Kirkwood Rd
- 35 Birchwood Way
- 513 N White Horse Pike
- 5 S White Horse Pike
- 1256 Kirkwood-Gibbsboro R
- 25 State Ave
- 1801 Egg Harbor Rd Unit 704
- 135 Madison Ave
- 109 State Ave
- 146 Chelsea Cir Unit A129
- 108 Chelsea Cir