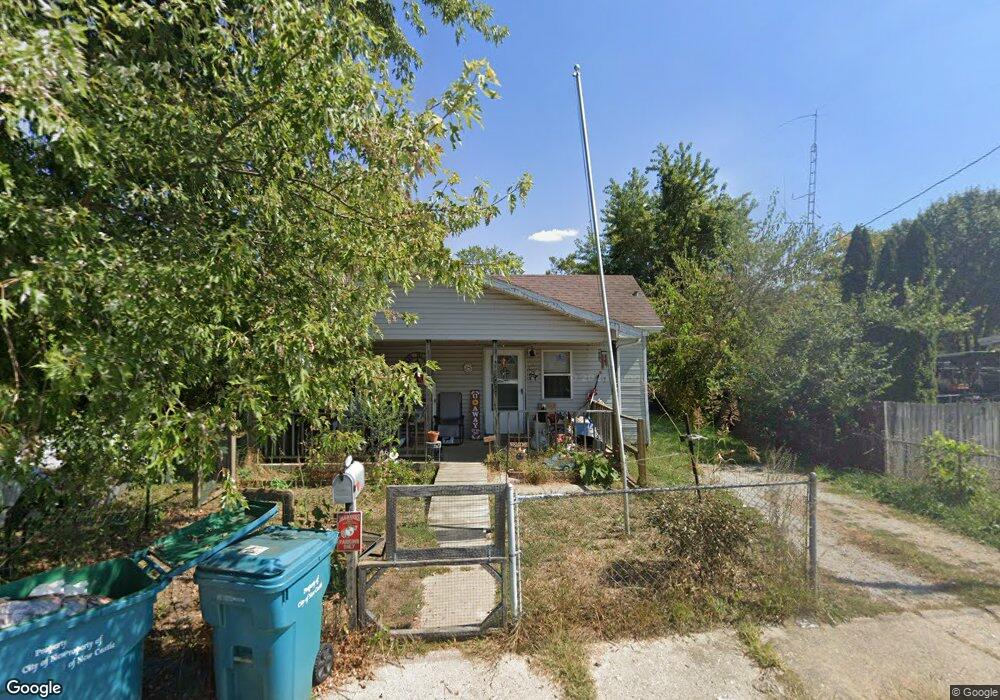
738 N Main St New Castle, IN 47362
Estimated Value: $120,103 - $140,000
2
Beds
1
Bath
986
Sq Ft
$128/Sq Ft
Est. Value
About This Home
This home is located at 738 N Main St, New Castle, IN 47362 and is currently estimated at $126,526, approximately $128 per square foot. 738 N Main St is a home located in Henry County with nearby schools including Agape Learning Center.
Ownership History
Date
Name
Owned For
Owner Type
Purchase Details
Closed on
Sep 17, 2019
Sold by
Robin Swim Richard
Bought by
Lindenmuth Richard
Current Estimated Value
Purchase Details
Closed on
Dec 19, 2005
Sold by
Swingley Daniel R
Bought by
Swim Richard and Swim Robin
Home Financials for this Owner
Home Financials are based on the most recent Mortgage that was taken out on this home.
Original Mortgage
$38,000
Interest Rate
11.85%
Mortgage Type
New Conventional
Purchase Details
Closed on
Nov 1, 2005
Sold by
Equicredit Corporation Of America
Bought by
Swingley Daniel R
Home Financials for this Owner
Home Financials are based on the most recent Mortgage that was taken out on this home.
Original Mortgage
$38,000
Interest Rate
11.85%
Mortgage Type
New Conventional
Purchase Details
Closed on
Jul 28, 2005
Sold by
Stagner Randall and Stagner Rebekah
Bought by
Equalcredit Corporation Of America
Create a Home Valuation Report for This Property
The Home Valuation Report is an in-depth analysis detailing your home's value as well as a comparison with similar homes in the area
Home Values in the Area
Average Home Value in this Area
Purchase History
| Date | Buyer | Sale Price | Title Company |
|---|---|---|---|
| Lindenmuth Richard | $3,501 | None Available | |
| Swim Richard | -- | Midwest Title Corporation | |
| Swingley Daniel R | -- | Investors Titlecorp | |
| Equalcredit Corporation Of America | $40,396 | None Available |
Source: Public Records
Mortgage History
| Date | Status | Borrower | Loan Amount |
|---|---|---|---|
| Previous Owner | Swim Richard | $38,000 |
Source: Public Records
Tax History Compared to Growth
Tax History
| Year | Tax Paid | Tax Assessment Tax Assessment Total Assessment is a certain percentage of the fair market value that is determined by local assessors to be the total taxable value of land and additions on the property. | Land | Improvement |
|---|---|---|---|---|
| 2024 | $881 | $88,100 | $15,400 | $72,700 |
| 2023 | $702 | $78,600 | $15,400 | $63,200 |
| 2022 | $548 | $52,600 | $10,300 | $42,300 |
| 2021 | $991 | $49,000 | $10,300 | $38,700 |
| 2020 | $1,020 | $49,000 | $10,300 | $38,700 |
| 2019 | $1,136 | $48,200 | $10,300 | $37,900 |
| 2018 | $2,371 | $47,400 | $10,300 | $37,100 |
| 2017 | $1,717 | $46,400 | $10,300 | $36,100 |
| 2016 | $824 | $49,000 | $10,800 | $38,200 |
| 2014 | -- | $44,900 | $10,800 | $34,100 |
| 2013 | -- | $43,400 | $10,800 | $32,600 |
Source: Public Records
Map
Nearby Homes
- 711 N 14th St
- 1510 Michigan St
- 411 Luellen Way
- 504 N 12th St
- 1506 Kentucky Ave
- 1324 Thornburg St
- 512 N 16th St
- 000 S St Rd 103
- 321 N Main St
- 000 Wittenbraker Ave
- 922 Spring St
- 1707 Woodward Ave
- 5** N Memorial Dr
- 2311 Alabama St
- 420 N 20th St
- 2332 Highland Ave
- 404 N 20th St
- 709 Broad St
- 224 Reddingdale Dr
- 2447 N East Raintree Dr