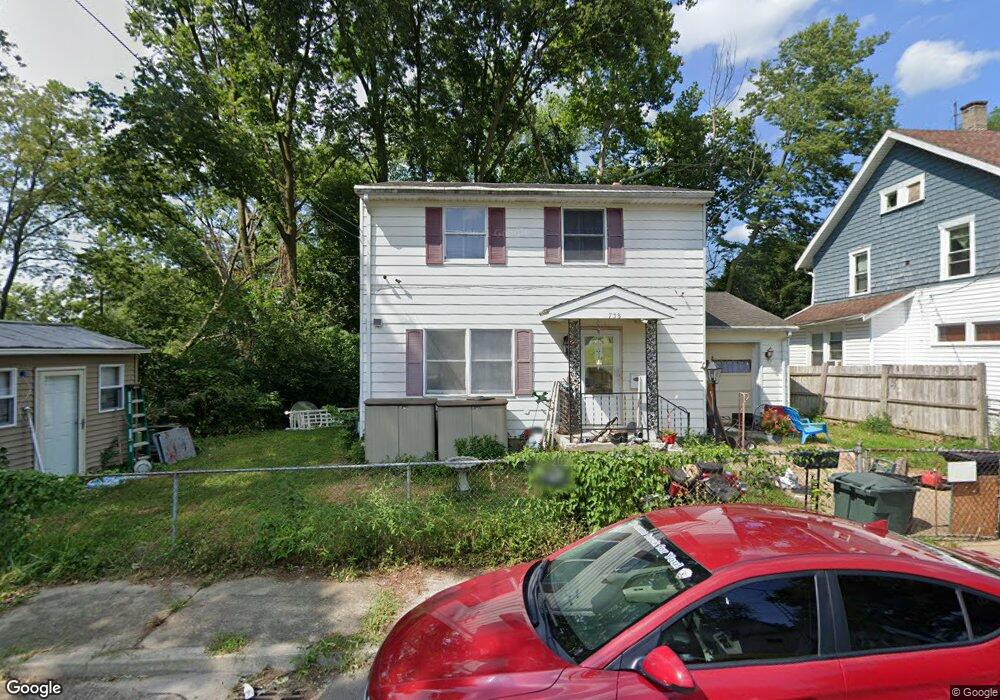
738 Rubsam St Springfield, OH 45504
Estimated Value: $78,000 - $142,000
2
Beds
2
Baths
1,152
Sq Ft
$87/Sq Ft
Est. Value
About This Home
This home is located at 738 Rubsam St, Springfield, OH 45504 and is currently estimated at $100,364, approximately $87 per square foot. 738 Rubsam St is a home located in Clark County with nearby schools including Snyder Park Elementary School, Roosevelt Middle School, and Springfield High School.
Ownership History
Date
Name
Owned For
Owner Type
Purchase Details
Closed on
Mar 18, 2010
Sold by
Lowe Norman R and Lowe Ladonna K
Bought by
Carey Bradley A
Current Estimated Value
Home Financials for this Owner
Home Financials are based on the most recent Mortgage that was taken out on this home.
Original Mortgage
$43,693
Outstanding Balance
$28,645
Interest Rate
5%
Mortgage Type
FHA
Estimated Equity
$71,719
Purchase Details
Closed on
Jan 30, 2009
Sold by
Countrywide Home Loans Inc
Bought by
Lowe Norman R and Lowe Ladonna K
Purchase Details
Closed on
Sep 19, 2008
Sold by
Hudson Daniel L and Hudson Daniel Lee
Bought by
Countrywide Home Loans Inc
Purchase Details
Closed on
Apr 11, 1997
Sold by
Backus Robert A
Bought by
Hudson Daniel L and Hudson Cindy
Home Financials for this Owner
Home Financials are based on the most recent Mortgage that was taken out on this home.
Original Mortgage
$48,400
Interest Rate
7.74%
Mortgage Type
VA
Create a Home Valuation Report for This Property
The Home Valuation Report is an in-depth analysis detailing your home's value as well as a comparison with similar homes in the area
Home Values in the Area
Average Home Value in this Area
Purchase History
| Date | Buyer | Sale Price | Title Company |
|---|---|---|---|
| Carey Bradley A | $44,500 | Attorney | |
| Lowe Norman R | $25,000 | Lawyers Title | |
| Countrywide Home Loans Inc | $20,000 | None Available | |
| Hudson Daniel L | $47,000 | -- |
Source: Public Records
Mortgage History
| Date | Status | Borrower | Loan Amount |
|---|---|---|---|
| Open | Carey Bradley A | $43,693 | |
| Previous Owner | Hudson Daniel L | $48,400 |
Source: Public Records
Tax History
| Year | Tax Paid | Tax Assessment Tax Assessment Total Assessment is a certain percentage of the fair market value that is determined by local assessors to be the total taxable value of land and additions on the property. | Land | Improvement |
|---|---|---|---|---|
| 2025 | $654 | $15,650 | $4,310 | $11,340 |
| 2024 | $637 | $13,220 | $3,720 | $9,500 |
| 2023 | $637 | $13,220 | $3,720 | $9,500 |
| 2022 | $653 | $13,220 | $3,720 | $9,500 |
| 2021 | $584 | $10,920 | $3,070 | $7,850 |
| 2020 | $585 | $10,920 | $3,070 | $7,850 |
| 2019 | $587 | $10,920 | $3,070 | $7,850 |
| 2018 | $489 | $8,750 | $3,620 | $5,130 |
| 2017 | $489 | $15,926 | $3,616 | $12,310 |
| 2016 | $891 | $15,926 | $3,616 | $12,310 |
| 2015 | $959 | $16,804 | $3,616 | $13,188 |
| 2014 | $955 | $16,804 | $3,616 | $13,188 |
| 2013 | $945 | $16,804 | $3,616 | $13,188 |
Source: Public Records
Map
Nearby Homes
- 424 N Shaffer St
- 424-424 1/2 N Shaffer St
- 430 N Jackson St
- 511 N Light St
- 705 Grant St Unit 705
- 705-705 1/2 Grant St Unit 705
- 423 N Jackson St Unit 425
- 239 N Shaffer St
- 222 N Race St Unit 224
- 366 N Isabella St
- 101`103 N Western
- 727 W High St
- 1015 Hillcrest Ave
- 1205 W High St
- 1420 Parker Ct
- 120 E Ward St
- 1225 W High St
- 1524 W North St Unit 1526
- 820 W 1st St
- 1417 W Main St
- 730 Rubsam St
- 730-732 Rubsam St
- 730 Rubsam St Unit 732
- 726 Rubsam St Unit 728
- 722 Rubsam St Unit 724
- 530 N Shaffer St
- 718 Rubsam St Unit 720
- 524 N Shaffer St
- 525 N Shaffer St
- 521 N Shaffer St Unit 523
- 721 Rubsam St
- 518 N Shaffer St
- 714 Rubsam St
- 517 N Shaffer St
- 613 N Light St
- 535 N Light St Unit 537
- 601 N Light St
- 605 N Light St
- 527 N Light St
- 740 Grant St
Your Personal Tour Guide
Ask me questions while you tour the home.