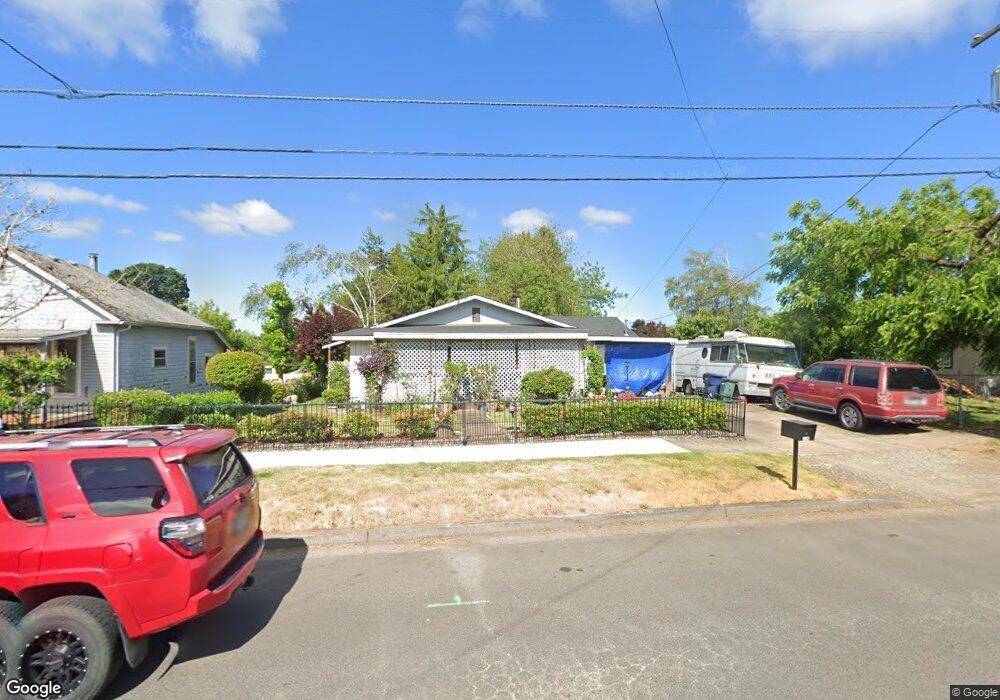
738 S 7th St Independence, OR 97351
Estimated Value: $366,000 - $411,000
4
Beds
2
Baths
1,727
Sq Ft
$228/Sq Ft
Est. Value
About This Home
This home is located at 738 S 7th St, Independence, OR 97351 and is currently estimated at $393,930, approximately $228 per square foot. 738 S 7th St is a home located in Polk County with nearby schools including Independence Elementary School, Talmadge Middle School, and Central High School.
Ownership History
Date
Name
Owned For
Owner Type
Purchase Details
Closed on
Apr 13, 2016
Sold by
Garcia Xavier D
Bought by
Garcia Piedad Z
Current Estimated Value
Purchase Details
Closed on
Sep 26, 2007
Sold by
Garcia Piedad Z
Bought by
Garcia Piedad Z and Garcia Xavier D
Purchase Details
Closed on
Sep 13, 2006
Sold by
Garcia Xavier D
Bought by
Garcia Piedad Z
Home Financials for this Owner
Home Financials are based on the most recent Mortgage that was taken out on this home.
Original Mortgage
$65,000
Interest Rate
6.56%
Mortgage Type
New Conventional
Purchase Details
Closed on
Jun 14, 2006
Sold by
Garcia Carlos and Garcia Piedad Z
Bought by
Garcia Piedad Z and Garcia Xavier D
Create a Home Valuation Report for This Property
The Home Valuation Report is an in-depth analysis detailing your home's value as well as a comparison with similar homes in the area
Home Values in the Area
Average Home Value in this Area
Purchase History
| Date | Buyer | Sale Price | Title Company |
|---|---|---|---|
| Garcia Piedad Z | -- | None Available | |
| Garcia Piedad Z | -- | Accommodation | |
| Garcia Piedad Z | -- | Accommodation | |
| Garcia Xavier D | -- | Ticor Title | |
| Garcia Piedad Z | -- | Accommodation |
Source: Public Records
Mortgage History
| Date | Status | Borrower | Loan Amount |
|---|---|---|---|
| Closed | Garcia Xavier D | $65,000 |
Source: Public Records
Tax History Compared to Growth
Tax History
| Year | Tax Paid | Tax Assessment Tax Assessment Total Assessment is a certain percentage of the fair market value that is determined by local assessors to be the total taxable value of land and additions on the property. | Land | Improvement |
|---|---|---|---|---|
| 2025 | $2,958 | $168,180 | $42,610 | $125,570 |
| 2024 | $2,958 | $163,290 | $41,370 | $121,920 |
| 2023 | $3,033 | $158,540 | $40,170 | $118,370 |
| 2022 | $2,785 | $153,930 | $39,000 | $114,930 |
| 2021 | $2,754 | $149,450 | $37,870 | $111,580 |
| 2020 | $2,682 | $145,100 | $36,770 | $108,330 |
| 2019 | $2,612 | $140,880 | $35,700 | $105,180 |
| 2018 | $2,529 | $136,780 | $34,660 | $102,120 |
| 2017 | $2,515 | $132,800 | $33,650 | $99,150 |
| 2016 | $2,562 | $128,940 | $32,670 | $96,270 |
| 2015 | $2,438 | $125,190 | $31,720 | $93,470 |
| 2014 | $2,387 | $121,550 | $30,800 | $90,750 |
Source: Public Records
Map
Nearby Homes