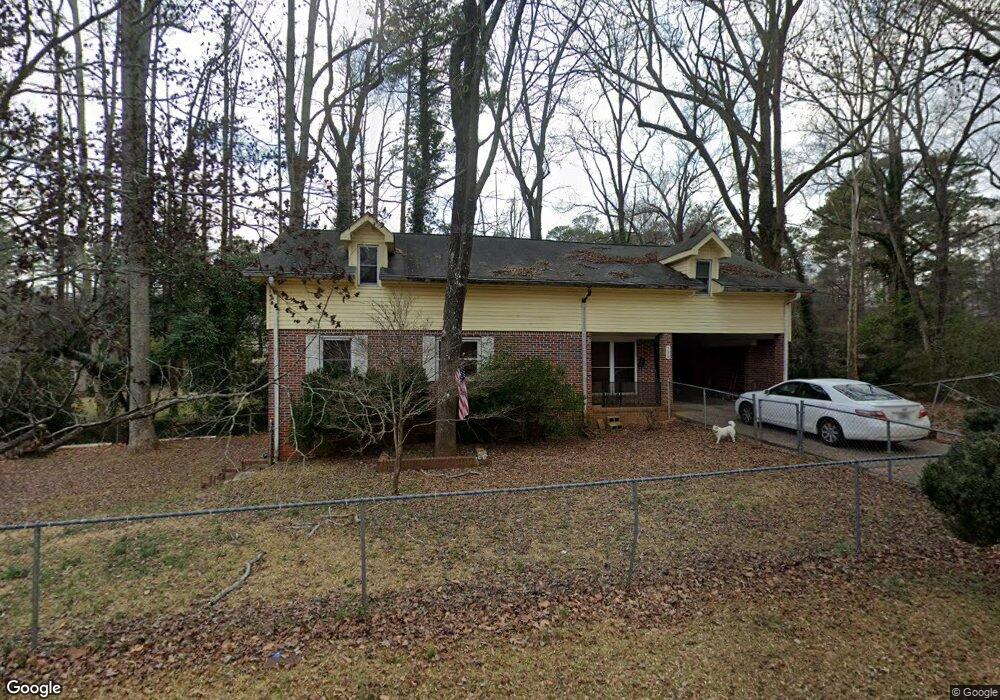
738 Springer Dr Griffin, GA 30224
Spalding County NeighborhoodEstimated Value: $250,215 - $281,000
3
Beds
3
Baths
1,872
Sq Ft
$144/Sq Ft
Est. Value
About This Home
This home is located at 738 Springer Dr, Griffin, GA 30224 and is currently estimated at $269,804, approximately $144 per square foot. 738 Springer Dr is a home located in Spalding County with nearby schools including Futral Road Elementary School, Rehoboth Road Middle School, and Spalding High School.
Ownership History
Date
Name
Owned For
Owner Type
Purchase Details
Closed on
Dec 17, 2021
Sold by
Cain Alexander
Bought by
Oxenford Aprille and Alexander Cain Liv Trust
Current Estimated Value
Purchase Details
Closed on
Sep 23, 2021
Sold by
Cain Mary Ellen
Bought by
Cain Alexander
Purchase Details
Closed on
Mar 20, 2002
Sold by
Cain Mary E
Bought by
Cain James D
Purchase Details
Closed on
Aug 24, 1982
Sold by
Wood David L and Wood Doris D
Bought by
Cain James D and Mary Ellen
Purchase Details
Closed on
Aug 28, 1975
Sold by
Aaron Roy D and Aaron Sydney D
Bought by
Wood David L and Wood Doris D
Purchase Details
Closed on
May 15, 1971
Sold by
Chaney James M
Bought by
Aaron Roy D and Mrs Sydney D
Purchase Details
Closed on
Aug 4, 1967
Sold by
Martin Jerry D
Bought by
Chaney James M
Purchase Details
Closed on
Aug 31, 1964
Sold by
Crowder James E
Bought by
Martin Jerry D
Purchase Details
Closed on
Mar 19, 1959
Bought by
Crowder James E
Create a Home Valuation Report for This Property
The Home Valuation Report is an in-depth analysis detailing your home's value as well as a comparison with similar homes in the area
Home Values in the Area
Average Home Value in this Area
Purchase History
| Date | Buyer | Sale Price | Title Company |
|---|---|---|---|
| Oxenford Aprille | -- | -- | |
| Cain Alexander | -- | -- | |
| Cain Mary Ellen | -- | -- | |
| Cain James D | -- | -- | |
| Cain James D | $26,100 | -- | |
| Wood David L | $30,000 | -- | |
| Aaron Roy D | $3,100 | -- | |
| Chaney James M | $18,700 | -- | |
| Martin Jerry D | $5,000 | -- | |
| Crowder James E | $1,700 | -- |
Source: Public Records
Tax History Compared to Growth
Tax History
| Year | Tax Paid | Tax Assessment Tax Assessment Total Assessment is a certain percentage of the fair market value that is determined by local assessors to be the total taxable value of land and additions on the property. | Land | Improvement |
|---|---|---|---|---|
| 2024 | $2,581 | $79,534 | $10,000 | $69,534 |
| 2023 | $2,581 | $70,912 | $10,000 | $60,912 |
| 2022 | $2,571 | $64,344 | $8,000 | $56,344 |
| 2021 | $2,315 | $60,273 | $8,000 | $52,273 |
| 2020 | $2,315 | $60,273 | $8,000 | $52,273 |
| 2019 | $1,764 | $45,704 | $6,400 | $39,304 |
| 2018 | $1,768 | $44,228 | $6,400 | $37,828 |
| 2017 | $1,730 | $44,228 | $6,400 | $37,828 |
| 2016 | $1,758 | $44,228 | $6,400 | $37,828 |
| 2015 | $1,787 | $44,228 | $6,400 | $37,828 |
| 2014 | $1,674 | $40,445 | $6,400 | $34,045 |
Source: Public Records
Map
Nearby Homes
- 818 Hillcrest Ave
- 524 Kincaid Ave
- 310 Terrace St
- 505 Kincaid Ave
- 714 Maple Dr
- 706 Maple Dr
- 40 Terrace St
- 922 Springer Dr
- 821 Bel Air Cir
- 134 Townsend Ct
- 831 Bel Air Cir
- 936 Springer Dr
- 650 S Hill St
- 941 Springer Dr
- 18 Terracedale Ct
- 1099 Pine Valley Rd
- 1104 Maple Dr
- 541 S 6th St
- 523 Ivy Rd
- 945 Finley St
- 750 Springer Dr
- 741 Springer Dr
- 749 Springer Dr
- 561 Crescent Rd
- 730 Springer Dr
- 735 Springer Dr
- 751 Springer Dr
- 551 Crescent Rd
- 729 Springer Dr
- 735 Clay St
- 735 Clay St Unit 174
- 728 Springer Dr
- 541 Crescent Rd
- 727 Springer Dr
- 625 Kincaid Ave
- 738 Bieze St
- 736 Bieze St
- 726 Springer Dr
- 731 Clay St
- 744 Bieze St