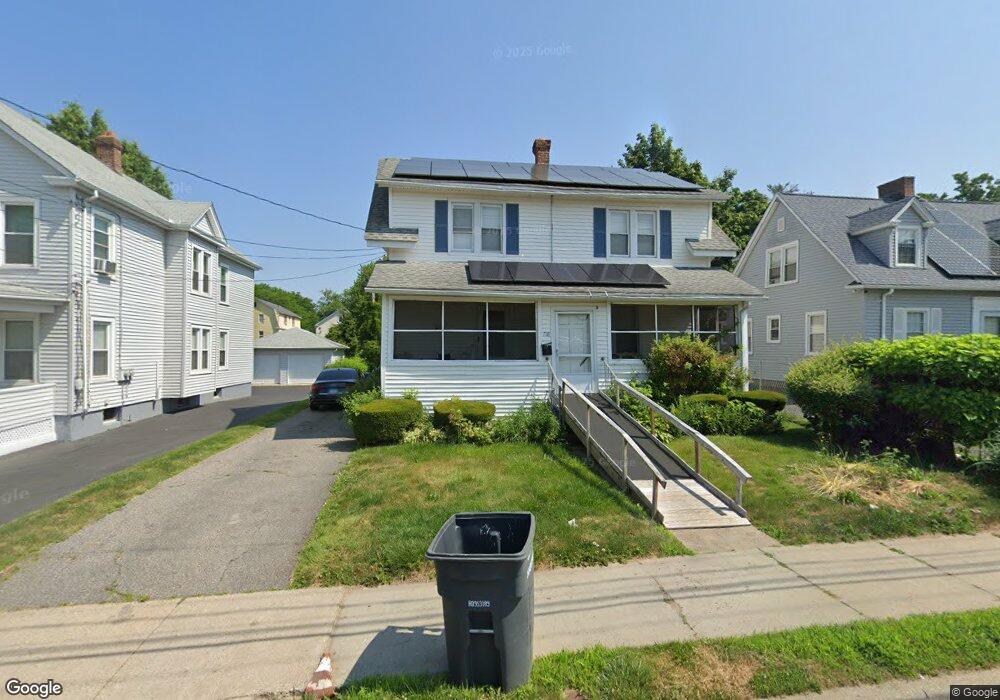
738 Tower Ave Hartford, CT 06112
Blue Hills NeighborhoodEstimated Value: $235,000 - $302,000
3
Beds
2
Baths
2,106
Sq Ft
$127/Sq Ft
Est. Value
About This Home
This home is located at 738 Tower Ave, Hartford, CT 06112 and is currently estimated at $267,560, approximately $127 per square foot. 738 Tower Ave is a home located in Hartford County with nearby schools including Rawson School, Breakthrough Magnet School - North Campus, and West Middle School.
Ownership History
Date
Name
Owned For
Owner Type
Purchase Details
Closed on
Oct 27, 2023
Sold by
Kusen Oleh
Bought by
Banning Candace S
Current Estimated Value
Home Financials for this Owner
Home Financials are based on the most recent Mortgage that was taken out on this home.
Original Mortgage
$189,905
Outstanding Balance
$186,384
Interest Rate
7.18%
Mortgage Type
Purchase Money Mortgage
Estimated Equity
$81,176
Purchase Details
Closed on
Oct 18, 2021
Sold by
Thomas Charlie N
Bought by
Charlie Nell Cleary Ret and Cleary
Create a Home Valuation Report for This Property
The Home Valuation Report is an in-depth analysis detailing your home's value as well as a comparison with similar homes in the area
Home Values in the Area
Average Home Value in this Area
Purchase History
| Date | Buyer | Sale Price | Title Company |
|---|---|---|---|
| Banning Candace S | $199,900 | None Available | |
| Charlie Nell Cleary Ret | -- | None Available | |
| Charlie Nell Cleary Ret | -- | None Available |
Source: Public Records
Mortgage History
| Date | Status | Borrower | Loan Amount |
|---|---|---|---|
| Open | Banning Candace S | $189,905 |
Source: Public Records
Tax History Compared to Growth
Tax History
| Year | Tax Paid | Tax Assessment Tax Assessment Total Assessment is a certain percentage of the fair market value that is determined by local assessors to be the total taxable value of land and additions on the property. | Land | Improvement |
|---|---|---|---|---|
| 2024 | $4,984 | $72,287 | $6,725 | $65,562 |
| 2023 | $4,984 | $72,287 | $6,725 | $65,562 |
| 2022 | $4,984 | $72,287 | $6,725 | $65,562 |
| 2021 | $3,830 | $51,555 | $7,945 | $43,610 |
| 2020 | $3,830 | $51,555 | $7,945 | $43,610 |
| 2019 | $3,830 | $51,555 | $7,945 | $43,610 |
| 2018 | $3,701 | $49,817 | $7,677 | $42,140 |
| 2016 | $3,565 | $47,993 | $7,312 | $40,681 |
| 2015 | $3,565 | $45,713 | $6,964 | $38,749 |
| 2014 | $3,313 | $44,596 | $6,794 | $37,802 |
Source: Public Records
Map
Nearby Homes
- 11 Pershing St Unit 13
- 355 Cornwall St Unit 357
- 86 Hartland St
- 90 Manchester St
- 36 Baltic St Unit 38
- 70 Burnham St Unit 72
- 179 Manchester St
- 152 Burnham St
- 97 E Burnham St
- 180 Andover St
- 117 E Pershing St
- 34 Gilbert Ave
- 157 Pembroke St Unit 159
- 180 Brookline Ave
- 171 N Canaan St
- 175 E Pershing St
- 144 Thomaston St
- 52 Greenwood Ave
- 287 Westland St
- 84 Love Ln Unit 86
- 734 Tower Ave
- 742 Tower Ave Unit 744
- 730 Tower Ave
- 746 Tower Ave
- 726 Tower Ave
- 29 Litchfield St
- 33 Litchfield St Unit 35
- 21 Litchfield St
- 756 Tower Ave
- 722 Tower Ave Unit 724
- 17 Litchfield St
- 25 Litchfield St
- 760 Tower Ave
- 37 Litchfield St Unit 39
- 43 Litchfield St Unit 45
- 753 Tower Ave
- 45 Litchfield St
- 527 Blue Hills Ave Unit 529
- 764 Tower Ave
- 47 Litchfield St Unit 49