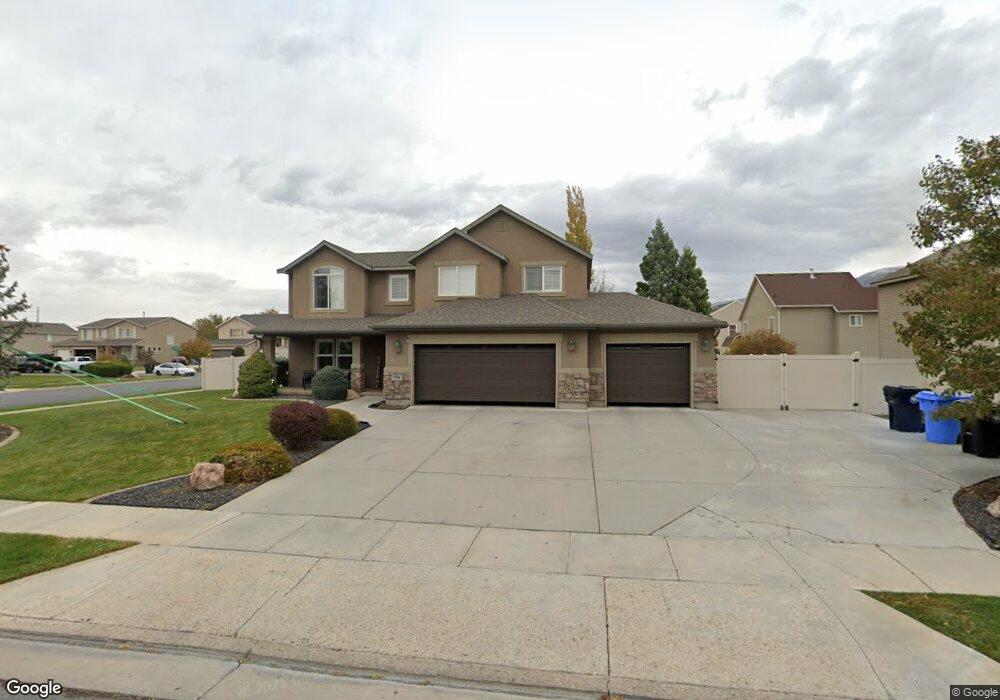
738 W 2090 N West Bountiful, UT 84087
Estimated Value: $579,000 - $661,000
4
Beds
3
Baths
2,464
Sq Ft
$251/Sq Ft
Est. Value
About This Home
This home is located at 738 W 2090 N, West Bountiful, UT 84087 and is currently estimated at $617,253, approximately $250 per square foot. 738 W 2090 N is a home located in Davis County with nearby schools including West Bountiful Elementary School, Bountiful Junior High School, and Viewmont High School.
Ownership History
Date
Name
Owned For
Owner Type
Purchase Details
Closed on
May 3, 2007
Sold by
Einerson Spike
Bought by
Einerson Spike and Einerson Joanna
Current Estimated Value
Home Financials for this Owner
Home Financials are based on the most recent Mortgage that was taken out on this home.
Original Mortgage
$247,000
Outstanding Balance
$149,343
Interest Rate
6.15%
Mortgage Type
New Conventional
Estimated Equity
$467,910
Purchase Details
Closed on
Apr 4, 2005
Sold by
Mchullin Homes Inc
Bought by
Einerson Spike and Einerson Joanna
Home Financials for this Owner
Home Financials are based on the most recent Mortgage that was taken out on this home.
Original Mortgage
$45,197
Interest Rate
5.7%
Mortgage Type
Stand Alone Second
Create a Home Valuation Report for This Property
The Home Valuation Report is an in-depth analysis detailing your home's value as well as a comparison with similar homes in the area
Home Values in the Area
Average Home Value in this Area
Purchase History
| Date | Buyer | Sale Price | Title Company |
|---|---|---|---|
| Einerson Spike | -- | Bonneville Superior Title Co | |
| Einerson Spike | -- | Bonneville Superior Title Co | |
| Einerson Spike | -- | None Available |
Source: Public Records
Mortgage History
| Date | Status | Borrower | Loan Amount |
|---|---|---|---|
| Open | Einerson Spike | $247,000 | |
| Closed | Einerson Spike | $45,197 |
Source: Public Records
Tax History Compared to Growth
Tax History
| Year | Tax Paid | Tax Assessment Tax Assessment Total Assessment is a certain percentage of the fair market value that is determined by local assessors to be the total taxable value of land and additions on the property. | Land | Improvement |
|---|---|---|---|---|
| 2025 | $3,470 | $303,050 | $132,670 | $170,380 |
| 2024 | $3,235 | $289,300 | $109,089 | $180,211 |
| 2023 | $3,245 | $534,000 | $206,433 | $327,567 |
| 2022 | $3,485 | $309,650 | $98,966 | $210,684 |
| 2021 | $3,288 | $454,000 | $133,412 | $320,588 |
| 2020 | $2,848 | $399,000 | $123,861 | $275,139 |
| 2019 | $2,834 | $393,000 | $125,032 | $267,968 |
| 2018 | $2,796 | $367,000 | $125,302 | $241,698 |
| 2016 | $2,269 | $167,640 | $32,755 | $134,885 |
| 2015 | $2,330 | $155,870 | $32,755 | $123,115 |
| 2014 | $2,240 | $161,786 | $32,755 | $129,031 |
| 2013 | -- | $135,253 | $32,661 | $102,592 |
Source: Public Records
Map
Nearby Homes
- 2257 N 830 W
- 668 W 2300 N
- 637 W 1600 N
- 988 W 1950 N Unit 134
- 548 S 675 W
- 825 W 1320 N
- 1084 W Audrey Ln Unit 20
- 1084 W Audrey Ln
- 324 S 600 W
- 239 Lyman Ln
- Lincoln Farmhouse Plan at Belmont Farms
- Belmont Traditional Plan at Belmont Farms
- Hampton Traditional Plan at Belmont Farms
- 234 Leah Cir
- 204 Lyman Ln
- 1552 N 200 W
- 235 W 1400 N
- 2 S 285 W
- 1410 N 200 W
- 366 W 1000 N