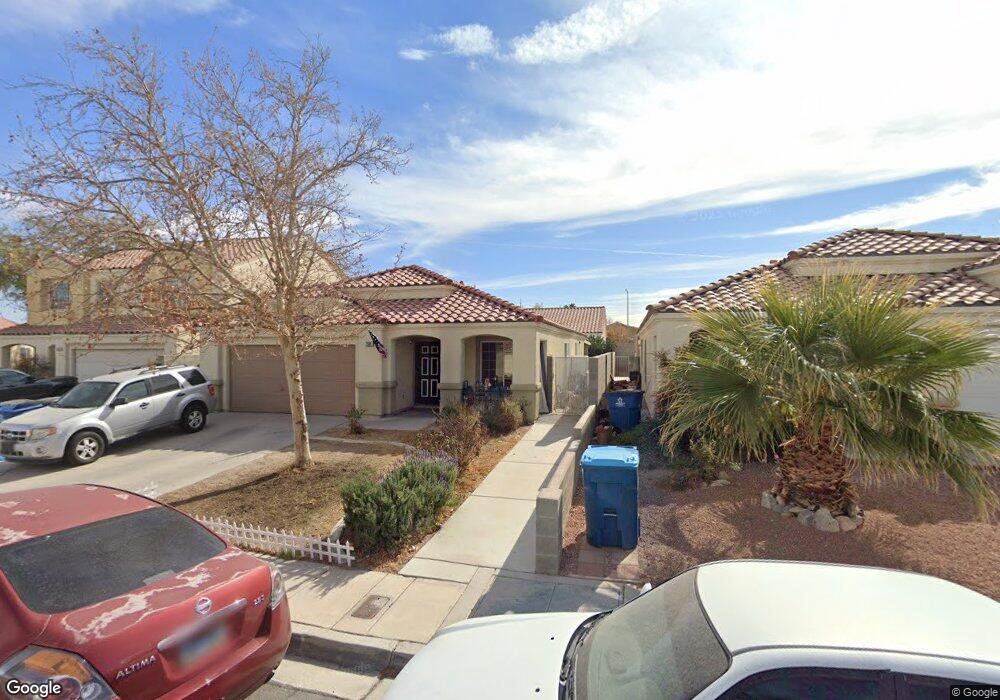
7381 Randel Jean Way Las Vegas, NV 89113
Estimated Value: $437,333 - $459,000
3
Beds
2
Baths
1,452
Sq Ft
$305/Sq Ft
Est. Value
About This Home
This home is located at 7381 Randel Jean Way, Las Vegas, NV 89113 and is currently estimated at $443,333, approximately $305 per square foot. 7381 Randel Jean Way is a home located in Clark County with nearby schools including Lucille S. Rogers Elementary School, Grant Sawyer Middle School, and Durango High School.
Ownership History
Date
Name
Owned For
Owner Type
Purchase Details
Closed on
Aug 22, 2023
Sold by
Danhieux Wendy A
Bought by
Koppe-Danhieux Trust and Koppe
Current Estimated Value
Purchase Details
Closed on
Apr 6, 2017
Sold by
Danhieux Gerald Phillip
Bought by
Danhieux Wendy and Danhieux Gerald
Purchase Details
Closed on
Sep 30, 2016
Sold by
Danhieux Wendy
Bought by
Danhiux Gerald P
Purchase Details
Closed on
Jul 23, 2000
Sold by
Danhienx Gerald Phillip
Bought by
Danhieux Wendy and Danhieux Gerald
Purchase Details
Closed on
Aug 9, 1999
Sold by
Kaufman & Broad Of Nevada Inc
Bought by
Danhieux Gerald P
Home Financials for this Owner
Home Financials are based on the most recent Mortgage that was taken out on this home.
Original Mortgage
$119,650
Interest Rate
7.7%
Create a Home Valuation Report for This Property
The Home Valuation Report is an in-depth analysis detailing your home's value as well as a comparison with similar homes in the area
Home Values in the Area
Average Home Value in this Area
Purchase History
| Date | Buyer | Sale Price | Title Company |
|---|---|---|---|
| Koppe-Danhieux Trust | -- | None Listed On Document | |
| Danhieux Wendy | -- | None Available | |
| Danhieeux Gerald | -- | None Available | |
| Danhiux Gerald P | -- | None Available | |
| Danhieux Wendy | -- | None Available | |
| Danhieux Wendy | $130,711 | None Available | |
| Danhieux Gerald P | $126,000 | United Title |
Source: Public Records
Mortgage History
| Date | Status | Borrower | Loan Amount |
|---|---|---|---|
| Previous Owner | Danhieux Gerald P | $119,650 |
Source: Public Records
Tax History Compared to Growth
Tax History
| Year | Tax Paid | Tax Assessment Tax Assessment Total Assessment is a certain percentage of the fair market value that is determined by local assessors to be the total taxable value of land and additions on the property. | Land | Improvement |
|---|---|---|---|---|
| 2025 | $1,829 | $102,778 | $40,250 | $62,528 |
| 2024 | $1,776 | $102,778 | $40,250 | $62,528 |
| 2023 | $1,776 | $93,812 | $34,650 | $59,162 |
| 2022 | $1,725 | $81,721 | $27,650 | $54,071 |
| 2021 | $1,675 | $77,720 | $26,250 | $51,470 |
| 2020 | $1,623 | $73,771 | $22,750 | $51,021 |
| 2019 | $1,576 | $71,029 | $20,650 | $50,379 |
| 2018 | $1,530 | $65,651 | $17,150 | $48,501 |
| 2017 | $1,924 | $65,609 | $16,450 | $49,159 |
| 2016 | $1,449 | $59,673 | $10,500 | $49,173 |
| 2015 | $1,446 | $49,533 | $8,750 | $40,783 |
| 2014 | $1,403 | $46,433 | $7,700 | $38,733 |
Source: Public Records
Map
Nearby Homes
- 7449 W Dewey Dr
- 7482 Lodano Ave
- 5678 Spring Trellis St
- 5470 Logville St
- 5680 Scottyboy Dr
- 7507 Pink Mimosa Ave
- 7413 W Russell Rd Unit 254
- 7280 Saxby Ave
- 7345 Aspire Ct
- 5734 Prima St
- 5790 Native Dancer Ct
- 7232 Deer View Ct
- 7716 Top Hat Ave
- 7086 Parkallen Ave
- 7058 Baza Ave
- 7707 Mocorito Ave
- 7719 Mocorito Ave
- 5515 Sancho Throne Rd
- 21 Sawgrass Ct
- 7704 Montefrio Ave
- 7389 Randel Jean Way
- 7373 Randel Jean Way
- 7397 Randel Jean Way
- 7388 W Dewey Dr
- 7380 W Dewey Dr
- 7396 W Dewey Dr
- 7365 Randel Jean Way
- 7413 Randel Jean Way
- 7372 W Dewey Dr
- 7404 W Dewey Dr
- 7390 Randel Jean Way
- 7382 Randel Jean Way
- 7382 Randel Jean Way
- 7398 Randel Jean Way
- 7364 W Dewey Dr
- 5586 Summer Joy St
- 7412 W Dewey Dr
- 7421 Randel Jean Way
- 7414 Randel Jean Way
- 5576 Summer Joy St