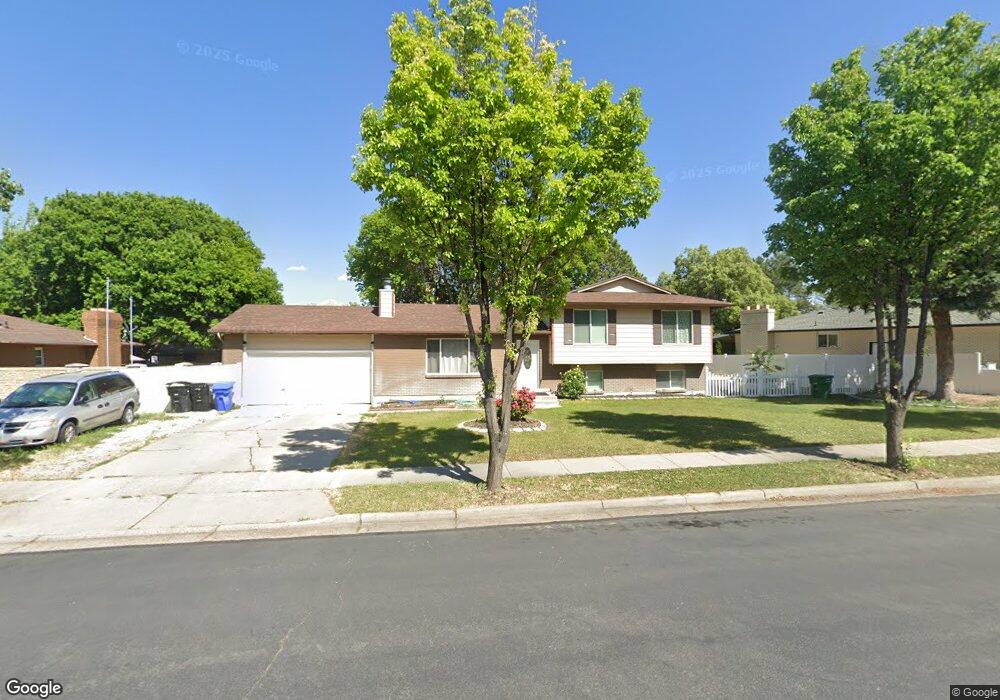
7381 Woodgreen Rd West Jordan, UT 84084
Estimated Value: $513,000 - $543,000
3
Beds
3
Baths
1,244
Sq Ft
$427/Sq Ft
Est. Value
About This Home
This home is located at 7381 Woodgreen Rd, West Jordan, UT 84084 and is currently estimated at $531,260, approximately $427 per square foot. 7381 Woodgreen Rd is a home located in Salt Lake County with nearby schools including Oquirrh Elementary School, Joel P. Jensen Middle School, and West Jordan High School.
Ownership History
Date
Name
Owned For
Owner Type
Purchase Details
Closed on
Dec 4, 2019
Sold by
Francisco Melchor D and Francisco Amelia
Bought by
Francisco Melchor D and Francisco Amelia T
Current Estimated Value
Purchase Details
Closed on
Dec 22, 2014
Sold by
Scriver Keith
Bought by
Francisco Melchor D and Francisco Amelia
Purchase Details
Closed on
Jul 27, 2007
Sold by
Scriver Shelley
Bought by
Scriver Keith
Purchase Details
Closed on
Jun 8, 2006
Sold by
Elmer Jerry A and Elmer Brenda C
Bought by
Scriver Keith and Scriver Shelley
Home Financials for this Owner
Home Financials are based on the most recent Mortgage that was taken out on this home.
Original Mortgage
$25,050
Interest Rate
6.15%
Mortgage Type
Stand Alone Second
Create a Home Valuation Report for This Property
The Home Valuation Report is an in-depth analysis detailing your home's value as well as a comparison with similar homes in the area
Home Values in the Area
Average Home Value in this Area
Purchase History
| Date | Buyer | Sale Price | Title Company |
|---|---|---|---|
| Francisco Melchor D | -- | None Available | |
| Francisco Melchor D | -- | First American Title | |
| Scriver Keith | -- | Equity Title | |
| Scriver Keith | -- | Equity Title |
Source: Public Records
Mortgage History
| Date | Status | Borrower | Loan Amount |
|---|---|---|---|
| Previous Owner | Scriver Keith | $25,050 | |
| Previous Owner | Scriver Keith | $133,600 |
Source: Public Records
Tax History Compared to Growth
Tax History
| Year | Tax Paid | Tax Assessment Tax Assessment Total Assessment is a certain percentage of the fair market value that is determined by local assessors to be the total taxable value of land and additions on the property. | Land | Improvement |
|---|---|---|---|---|
| 2025 | $2,370 | $475,200 | $171,000 | $304,200 |
| 2024 | $2,370 | $455,900 | $163,800 | $292,100 |
| 2023 | $2,388 | $433,000 | $154,500 | $278,500 |
| 2022 | $2,316 | $413,200 | $151,500 | $261,700 |
| 2021 | $1,954 | $317,300 | $116,200 | $201,100 |
| 2020 | $1,837 | $280,000 | $116,200 | $163,800 |
| 2019 | $1,829 | $273,300 | $90,900 | $182,400 |
| 2018 | $1,725 | $255,700 | $87,800 | $167,900 |
| 2017 | $1,462 | $215,700 | $87,800 | $127,900 |
| 2016 | $1,406 | $195,000 | $87,800 | $107,200 |
| 2015 | $1,537 | $207,800 | $87,000 | $120,800 |
| 2014 | $1,515 | $201,700 | $85,300 | $116,400 |
Source: Public Records
Map
Nearby Homes
- 7122 S Wood Green Rd
- 7611 S Springbrook Dr
- 3422 Briar Dr
- 3354 W 7800 S
- 7604 S Autumn Dr
- 6980 S 3535 W Unit 2
- 6968 S 3535 W Unit 3
- 6992 W Terraine Rd
- 3629 W 7825 S
- 3165 W 7720 S
- 6978 W Terraine Rd
- 6894 S 3420 W
- 3476 W Spaulding Rd
- 3383 W 6880 S
- 2886 W 7550 S
- 3647 W 7865 S
- 6863 S Dixie Dr
- 6893 S 3200 W
- 3546 W 7980 S
- 8524 S Michele River Ave W Unit 109
- 7381 S Woodgreen Rd
- 7393 Woodgreen Rd
- 7365 S Woodgreen Rd
- 7365 Woodgreen Rd
- 3455 W 7380 S
- 3456 W 7380 S
- 3502 W Farrington Ct
- 3502 Farrington Ct
- 3502 W 7380 S
- 3511 Farrington Ct
- 7353 S Woodgreen Rd
- 7353 Woodgreen Rd
- 3490 Charing Cross Rd
- 3450 W 7380 S
- 3480 Charing Cross Rd
- 3449 W 7380 S
- 7352 Woodgreen Rd
- 3468 Charing Cross Rd
- 3514 Farrington Ct
- 7438 Woodgreen Rd