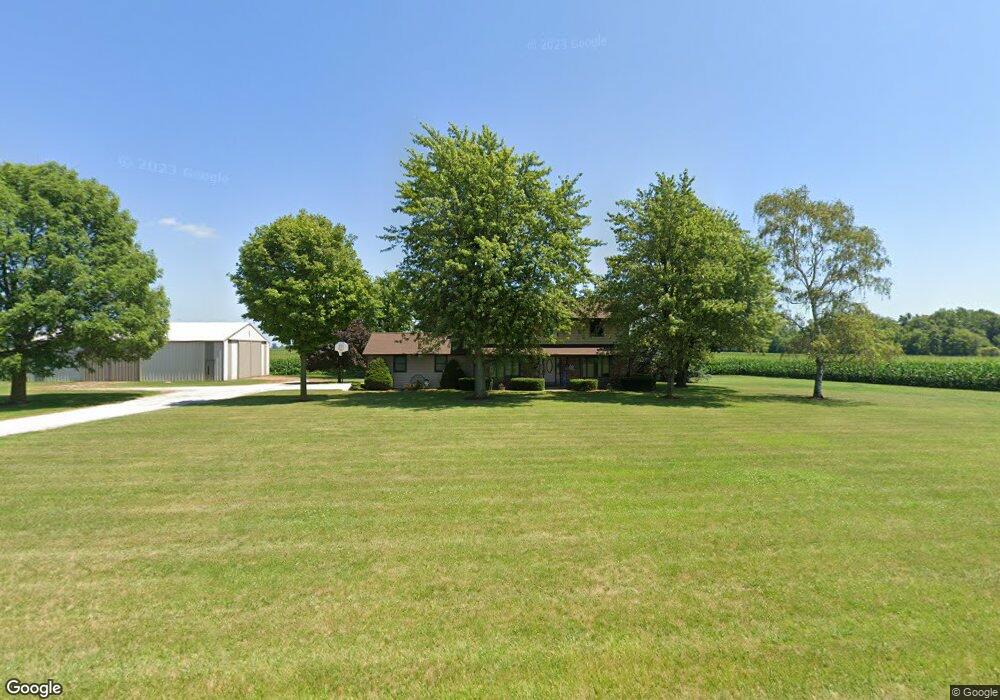
7383 Breininger Rd Hicksville, OH 43526
Estimated Value: $259,000 - $310,000
4
Beds
2
Baths
2,400
Sq Ft
$119/Sq Ft
Est. Value
About This Home
This home is located at 7383 Breininger Rd, Hicksville, OH 43526 and is currently estimated at $286,693, approximately $119 per square foot. 7383 Breininger Rd is a home with nearby schools including Fairview Elementary School, Fairview Middle School, and Fairview High School.
Ownership History
Date
Name
Owned For
Owner Type
Purchase Details
Closed on
Sep 24, 2020
Sold by
Karacson Maria A and Moats Maria A
Bought by
Mickelson Brett and Mickelson Nichole M
Current Estimated Value
Home Financials for this Owner
Home Financials are based on the most recent Mortgage that was taken out on this home.
Original Mortgage
$185,250
Outstanding Balance
$164,770
Interest Rate
2.9%
Mortgage Type
New Conventional
Estimated Equity
$121,923
Purchase Details
Closed on
Sep 21, 2016
Sold by
Karacson Maria A
Bought by
Karacson Maria A and Charles P Karacson Irrevocable Trust
Purchase Details
Closed on
Jun 2, 2006
Sold by
Karacson Charles P and Karacson Donna
Bought by
Karacson Charles P and Karacson Donna
Home Financials for this Owner
Home Financials are based on the most recent Mortgage that was taken out on this home.
Original Mortgage
$60,898
Interest Rate
6.62%
Mortgage Type
Future Advance Clause Open End Mortgage
Create a Home Valuation Report for This Property
The Home Valuation Report is an in-depth analysis detailing your home's value as well as a comparison with similar homes in the area
Home Values in the Area
Average Home Value in this Area
Purchase History
| Date | Buyer | Sale Price | Title Company |
|---|---|---|---|
| Mickelson Brett | $195,000 | None Available | |
| Karacson Maria A | -- | None Available | |
| Karacson Charles P | -- | None Available |
Source: Public Records
Mortgage History
| Date | Status | Borrower | Loan Amount |
|---|---|---|---|
| Open | Mickelson Brett | $185,250 | |
| Previous Owner | Karacson Charles P | $60,898 |
Source: Public Records
Tax History Compared to Growth
Tax History
| Year | Tax Paid | Tax Assessment Tax Assessment Total Assessment is a certain percentage of the fair market value that is determined by local assessors to be the total taxable value of land and additions on the property. | Land | Improvement |
|---|---|---|---|---|
| 2024 | $2,423 | $72,110 | $5,880 | $66,230 |
| 2023 | $2,423 | $72,110 | $5,880 | $66,230 |
| 2022 | $2,242 | $54,780 | $5,450 | $49,330 |
| 2021 | $2,242 | $54,780 | $5,450 | $49,330 |
| 2020 | $2,219 | $54,660 | $5,330 | $49,330 |
| 2019 | $1,936 | $49,410 | $5,610 | $43,800 |
| 2018 | $2,007 | $48,330 | $5,610 | $42,720 |
| 2017 | $1,908 | $56,511 | $13,790 | $42,721 |
| 2016 | $1,909 | $48,486 | $11,410 | $37,076 |
| 2015 | $860 | $48,486 | $11,410 | $37,076 |
| 2014 | $860 | $47,376 | $11,410 | $35,966 |
| 2013 | $860 | $46,067 | $10,101 | $35,966 |
| 2012 | $860 | $46,067 | $10,101 | $35,966 |
Source: Public Records
Map
Nearby Homes
- 0 Wonderly Rd
- 9819 Ohio 249
- 8320 Openlander Rd
- 909 E High St
- 7580 Hicksville Edgerton Rd
- 516 Ogen St
- 424 E High St
- 505 E Smith St
- 307 Wendell Ave
- 203 S Main St
- 308 S Main St
- 127 Dixon Ave
- 507 N Main St
- 217 W Edgerton St
- 202 Spencerville St
- 7155 Casebeer Miller Rd
- 307 Spencerville St
- 319 W High St
- 105 Clearview Dr
- 338 Chicago Ave
- 7147 Breininger Rd
- 8030 Huber Rd
- 7923 Huber Rd
- 7861 Huber Rd
- 7630 Huber Rd
- 7592 Huber Rd
- 8486 Huber Rd
- 8486 Huber Rd
- 7826 Buckskin Rd
- 8564 Huber Rd
- 7426 Huber Rd
- 7557 Buckskin Rd
- 8519 Buckskin Rd
- 6784 State Route 2
- 7363 Buckskin Rd
- 6814 State Route 2
- 7496 Buckskin Rd
- 8844 Blacker Rd
- 6826 State Route 2
- 7404 Buckskin Rd