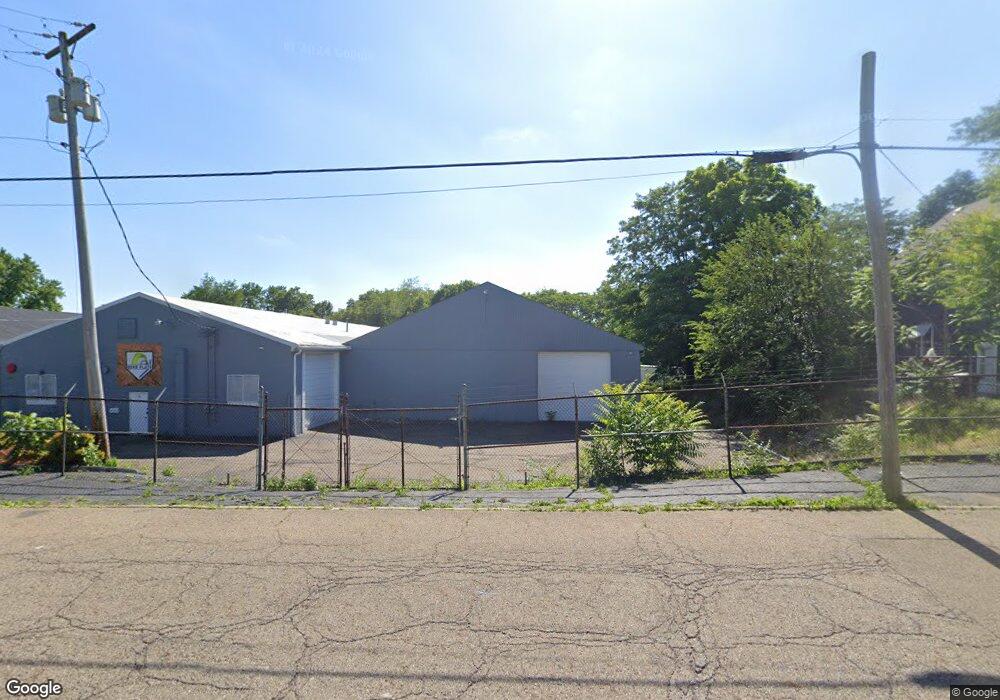
739 3rd St SE Massillon, OH 44646
Downtown Massillon NeighborhoodEstimated Value: $297,972
--
Bed
1
Bath
12,220
Sq Ft
$24/Sq Ft
Est. Value
About This Home
This home is located at 739 3rd St SE, Massillon, OH 44646 and is currently estimated at $297,972, approximately $24 per square foot. 739 3rd St SE is a home located in Stark County with nearby schools including Massillon Intermediate School, Massillon Junior High School, and Washington High School.
Ownership History
Date
Name
Owned For
Owner Type
Purchase Details
Closed on
Oct 25, 2021
Sold by
Home Plate Of Western Stark Llc
Bought by
Hobbes Properties Ltd
Current Estimated Value
Purchase Details
Closed on
Oct 31, 2013
Sold by
Lynn Truck Parts & Services Center Inc
Bought by
Home Plate Of Western Stark Llc
Home Financials for this Owner
Home Financials are based on the most recent Mortgage that was taken out on this home.
Original Mortgage
$142,500
Interest Rate
4.5%
Mortgage Type
Future Advance Clause Open End Mortgage
Purchase Details
Closed on
Dec 7, 2006
Sold by
Dewald Arnold W and Dewald Marian L
Bought by
Dewald William and Dewald Daniel
Purchase Details
Closed on
Oct 23, 2002
Sold by
Springhill Condominiums Inc
Bought by
Dewald Arnold W and Dewald Marian L
Create a Home Valuation Report for This Property
The Home Valuation Report is an in-depth analysis detailing your home's value as well as a comparison with similar homes in the area
Home Values in the Area
Average Home Value in this Area
Purchase History
| Date | Buyer | Sale Price | Title Company |
|---|---|---|---|
| Hobbes Properties Ltd | $242,800 | None Available | |
| Home Plate Of Western Stark Llc | $190,000 | Heritage Union Title Co Ltd | |
| Dewald William | -- | None Available | |
| Dewald Arnold W | $138,900 | -- |
Source: Public Records
Mortgage History
| Date | Status | Borrower | Loan Amount |
|---|---|---|---|
| Previous Owner | Home Plate Of Western Stark Llc | $142,500 |
Source: Public Records
Tax History Compared to Growth
Tax History
| Year | Tax Paid | Tax Assessment Tax Assessment Total Assessment is a certain percentage of the fair market value that is determined by local assessors to be the total taxable value of land and additions on the property. | Land | Improvement |
|---|---|---|---|---|
| 2025 | -- | $75,150 | $18,660 | $56,490 |
| 2024 | -- | $75,150 | $18,660 | $56,490 |
| 2023 | $3,734 | $39,980 | $4,800 | $35,180 |
| 2022 | $1,262 | $41,200 | $4,800 | $36,400 |
| 2021 | $2,862 | $46,170 | $4,830 | $41,340 |
| 2020 | $2,780 | $41,970 | $4,380 | $37,590 |
| 2019 | $2,761 | $41,970 | $4,380 | $37,590 |
| 2018 | $2,670 | $41,970 | $4,380 | $37,590 |
| 2017 | $2,934 | $42,750 | $4,170 | $38,580 |
| 2016 | $2,949 | $42,750 | $4,170 | $38,580 |
| 2015 | $2,931 | $42,750 | $4,170 | $38,580 |
| 2014 | $853 | $39,630 | $3,890 | $35,740 |
| 2013 | $1,448 | $39,630 | $3,890 | $35,740 |
Source: Public Records
Map
Nearby Homes
- 652 Young St SE
- 233 Edwin Ave SE
- 17 Maple Ave SE
- 804 Erie St S
- 202 Rose Ave SE
- 1319 Walnut Rd SE
- 509 Tremont Ave SE
- 824 Oak Ave SE
- 1225 Erie St S
- 46 5th St SE
- 532 4th St SW
- 1117 Cleveland St SW
- 1274 13th St SE
- 637 Wallace Ave SE
- 832 Wellman Ave SE
- 3476 Joyce Ave NW Unit 15
- 3414 Joyce Ave NW Unit 18
- Lot 42 Joyce Ave NW
- 0 Pearl SE Unit 5155028
- 521 Federal Ave NE
- 727 3rd St SE
- 723 3rd St SE
- 719 3rd St SE
- 719 3rd St SE
- 719 3rd St SE
- 732 3rd St SE
- 715 3rd St SE
- 713 3rd St SE
- 801 Walnut Rd SE
- 750 3rd St SE
- 709 3rd St SE
- 803 Walnut Rd SE
- 222 Maple Ave SE
- 226 Maple Ave SE
- 216 Maple Ave SE
- 210 Maple Ave SE
- 760 3rd St SE
- 232 Maple Ave SE
- 206 Maple Ave SE
- 203 Rawson Ave SE