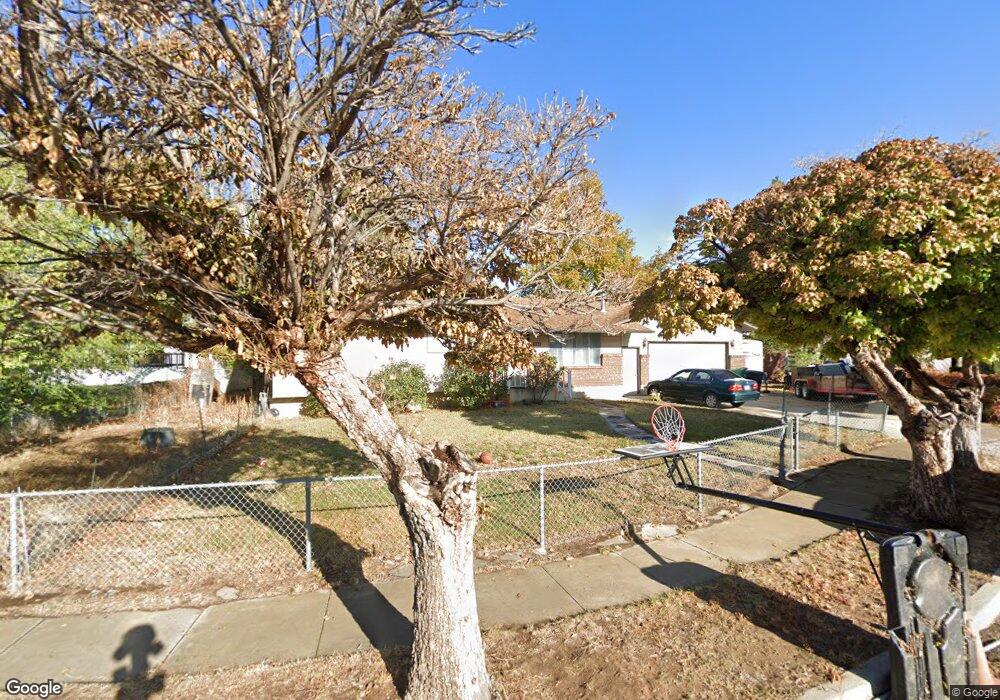
739 Barlow St Clearfield, UT 84015
Estimated Value: $440,000 - $471,000
5
Beds
3
Baths
2,186
Sq Ft
$208/Sq Ft
Est. Value
About This Home
This home is located at 739 Barlow St, Clearfield, UT 84015 and is currently estimated at $455,259, approximately $208 per square foot. 739 Barlow St is a home located in Davis County with nearby schools including Doxey Elementary School, North Davis Junior High School, and Clearfield High School.
Ownership History
Date
Name
Owned For
Owner Type
Purchase Details
Closed on
Sep 9, 2019
Sold by
Cooper Jon Steven
Bought by
Cooper Jon Steven
Current Estimated Value
Home Financials for this Owner
Home Financials are based on the most recent Mortgage that was taken out on this home.
Original Mortgage
$186,973
Outstanding Balance
$163,754
Interest Rate
3.7%
Mortgage Type
VA
Estimated Equity
$291,505
Purchase Details
Closed on
May 29, 2012
Sold by
House Sondra L
Bought by
Cooper Jon Steven
Home Financials for this Owner
Home Financials are based on the most recent Mortgage that was taken out on this home.
Original Mortgage
$158,332
Interest Rate
3.86%
Mortgage Type
VA
Create a Home Valuation Report for This Property
The Home Valuation Report is an in-depth analysis detailing your home's value as well as a comparison with similar homes in the area
Home Values in the Area
Average Home Value in this Area
Purchase History
| Date | Buyer | Sale Price | Title Company |
|---|---|---|---|
| Cooper Jon Steven | -- | First American Title | |
| Cooper Jon Steven | -- | Security Title Of Davis |
Source: Public Records
Mortgage History
| Date | Status | Borrower | Loan Amount |
|---|---|---|---|
| Open | Cooper Jon Steven | $186,973 | |
| Closed | Cooper Jon Steven | $158,332 |
Source: Public Records
Tax History
| Year | Tax Paid | Tax Assessment Tax Assessment Total Assessment is a certain percentage of the fair market value that is determined by local assessors to be the total taxable value of land and additions on the property. | Land | Improvement |
|---|---|---|---|---|
| 2025 | $2,854 | $255,750 | $89,383 | $166,367 |
| 2024 | $2,742 | $247,500 | $85,349 | $162,151 |
| 2023 | $2,535 | $420,000 | $135,140 | $284,860 |
| 2022 | $2,664 | $238,700 | $75,748 | $162,952 |
| 2021 | $2,312 | $313,000 | $87,786 | $225,214 |
| 2020 | $2,023 | $272,000 | $75,242 | $196,758 |
| 2019 | $1,966 | $261,000 | $73,755 | $187,245 |
| 2018 | $1,740 | $225,000 | $65,049 | $159,951 |
| 2016 | $1,516 | $102,520 | $26,633 | $75,887 |
| 2015 | $1,457 | $93,940 | $26,633 | $67,307 |
| 2014 | $1,426 | $93,165 | $26,633 | $66,532 |
| 2013 | -- | $71,841 | $28,502 | $43,339 |
Source: Public Records
Map
Nearby Homes
- 690 Barlow St
- 721 N 800 W
- 844 N 1000 W
- 1038 W 800 N
- 626 W 800 N
- 1125 W 700 N
- 1180 W 700 N
- 1103 W 950 N
- 768 W 1090 N
- 417 N 1200 W Unit 84
- 777 W 300 N
- 1132 N 780 W
- 35 N 1275 W Unit 103
- 1239 W 400 N Unit 63
- 303 N Canterbury Way
- 1161 W 325 N
- 1251 W 400 N Unit 67
- 563 N 1350 W Unit 139
- 1350 W 300 N Unit 29
- 1019 W 200 N
Your Personal Tour Guide
Ask me questions while you tour the home.