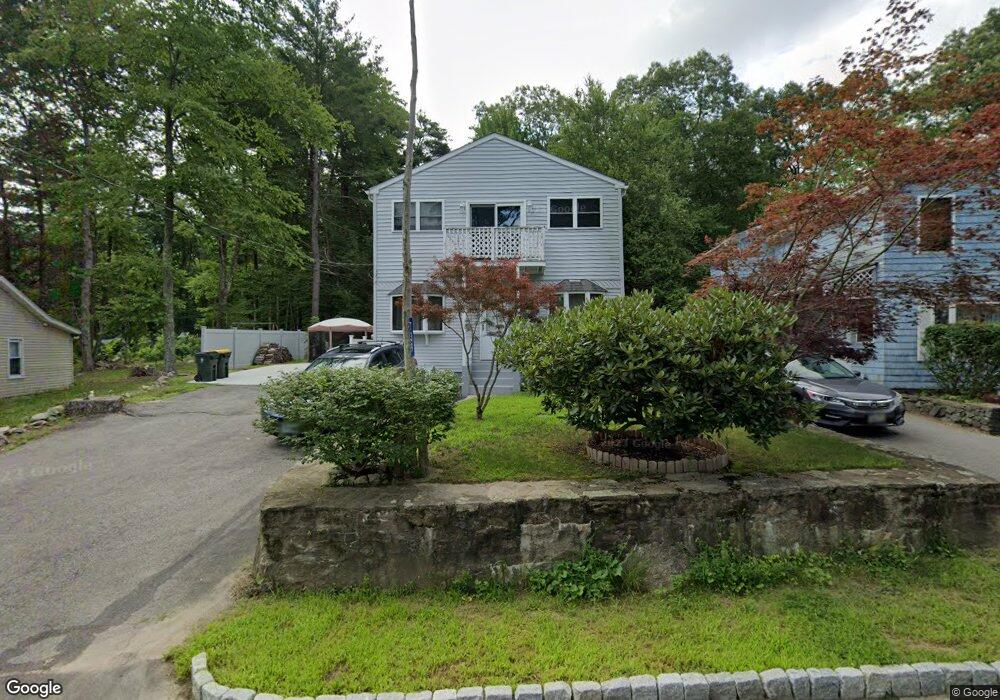
739 Black Hut Rd Glendale, RI 02826
Burrillville NeighborhoodEstimated Value: $433,000 - $589,000
3
Beds
2
Baths
1,829
Sq Ft
$263/Sq Ft
Est. Value
About This Home
This home is located at 739 Black Hut Rd, Glendale, RI 02826 and is currently estimated at $481,703, approximately $263 per square foot. 739 Black Hut Rd is a home located in Providence County with nearby schools including Austin T. Levy School, Burrillville Middle School, and Burrillville High School.
Ownership History
Date
Name
Owned For
Owner Type
Purchase Details
Closed on
Jun 20, 1997
Sold by
Lefebvre Wayne R and Lefebvre Debra
Bought by
Blazejewski Gary F
Current Estimated Value
Purchase Details
Closed on
Jan 2, 1992
Sold by
Avco Fncl Svcs Ri
Bought by
Lefebvre Debra R
Create a Home Valuation Report for This Property
The Home Valuation Report is an in-depth analysis detailing your home's value as well as a comparison with similar homes in the area
Home Values in the Area
Average Home Value in this Area
Purchase History
| Date | Buyer | Sale Price | Title Company |
|---|---|---|---|
| Blazejewski Gary F | $123,500 | -- | |
| Lefebvre Debra R | $61,000 | -- |
Source: Public Records
Mortgage History
| Date | Status | Borrower | Loan Amount |
|---|---|---|---|
| Closed | Lefebvre Debra R | $22,660 | |
| Open | Lefebvre Debra R | $50,000 | |
| Closed | Lefebvre Debra R | $10,000 |
Source: Public Records
Tax History Compared to Growth
Tax History
| Year | Tax Paid | Tax Assessment Tax Assessment Total Assessment is a certain percentage of the fair market value that is determined by local assessors to be the total taxable value of land and additions on the property. | Land | Improvement |
|---|---|---|---|---|
| 2025 | $4,449 | $373,900 | $82,300 | $291,600 |
| 2024 | $4,292 | $286,500 | $65,900 | $220,600 |
| 2023 | $4,123 | $286,500 | $65,900 | $220,600 |
| 2022 | $3,985 | $286,500 | $65,900 | $220,600 |
| 2021 | $4,228 | $257,500 | $68,100 | $189,400 |
| 2020 | $4,123 | $257,500 | $68,100 | $189,400 |
| 2019 | $4,120 | $257,500 | $68,100 | $189,400 |
| 2018 | $4,079 | $224,100 | $61,200 | $162,900 |
| 2017 | $3,935 | $224,100 | $61,200 | $162,900 |
| 2016 | $3,897 | $224,100 | $61,200 | $162,900 |
| 2015 | $3,818 | $202,200 | $61,800 | $140,400 |
| 2014 | $3,818 | $202,200 | $61,800 | $140,400 |
Source: Public Records
Map
Nearby Homes
- 517 Black Hut Rd
- 380 Joslin Rd
- 233 Whipple Ave
- 1835 Broncos Hwy
- 1932 Victory Hwy
- 1885 Victory Hwy
- 448 Chapel St
- 65 Oakland Ave
- 11 Central St
- 42 Steere Farm Rd
- 161 Graniteville Rd
- 600 Whipple Ave
- 632 Whipple Ave
- 0 Douglas Pike
- 361 Chapel St
- 22 Sanwood Dr
- 0 E Wallum Lake Rd Unit 1386401
- 0 E Wallum Lake Rd Unit 1386398
- 0 Mowry St
- 12 Dion Dr
- 731 Black Hut Rd
- 731 Black Hut Rd
- 732 Black Hut Rd
- 729 Black Hut Rd
- 729 Black Hut Rd
- 755 Black Hut Rd
- 730 Black Hut Rd
- 725 Black Hut Rd
- 740 Black Hut Rd
- 730 Black Hut Rd
- 725 Black Hut Rd
- 750 Black Hut Rd
- 728 Black Hut Rd
- 765 Black Hut Rd
- 726 Black Hut Rd
- 715 Black Hut Rd
- 715 Black Hut Rd
- 754 Black Hut Rd
- 722 Black Hut Rd
- 756 Black Hut Rd