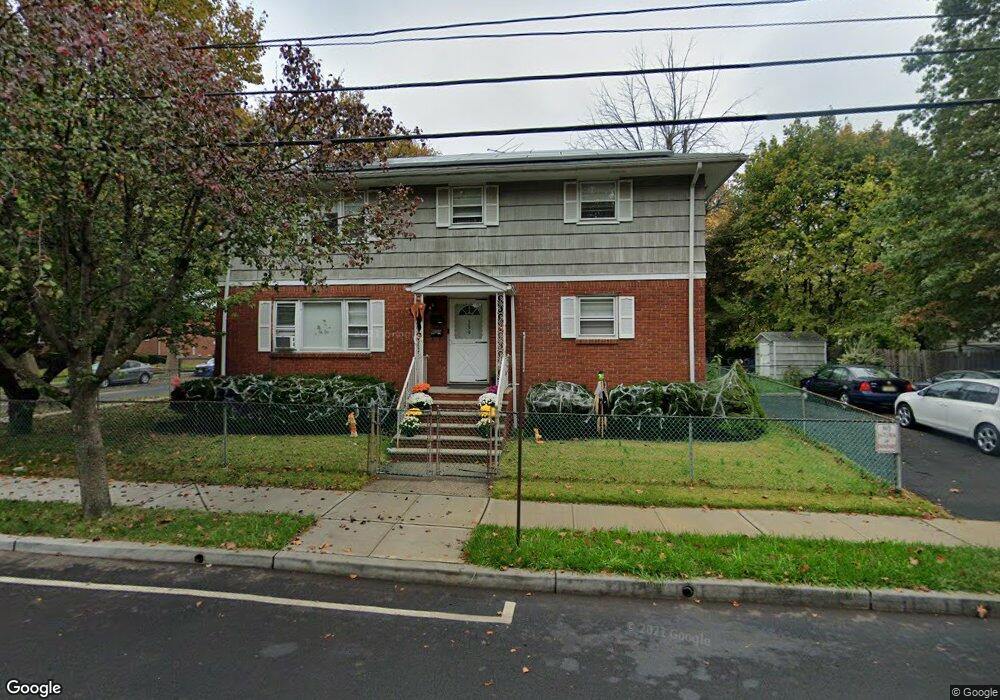
739 Burnside St Unit 2 Orange, NJ 07050
Estimated Value: $612,000 - $780,000
3
Beds
1
Bath
2,240
Sq Ft
$300/Sq Ft
Est. Value
About This Home
This home is located at 739 Burnside St Unit 2, Orange, NJ 07050 and is currently estimated at $671,208, approximately $299 per square foot. 739 Burnside St Unit 2 is a home located in Essex County.
Ownership History
Date
Name
Owned For
Owner Type
Purchase Details
Closed on
Mar 27, 2025
Sold by
Toomer Franklyn A and Colon Leisy
Bought by
Estevez Alexandra
Current Estimated Value
Home Financials for this Owner
Home Financials are based on the most recent Mortgage that was taken out on this home.
Original Mortgage
$486,000
Outstanding Balance
$483,834
Interest Rate
6.63%
Mortgage Type
New Conventional
Estimated Equity
$187,374
Purchase Details
Closed on
May 13, 2021
Sold by
Listner Michael and Listner Raquel
Bought by
Marex Mark and Chen Christina
Home Financials for this Owner
Home Financials are based on the most recent Mortgage that was taken out on this home.
Original Mortgage
$1,048,000
Interest Rate
3%
Mortgage Type
New Conventional
Purchase Details
Closed on
Jun 17, 2014
Sold by
Jefferson George and Jefferson Nancy
Bought by
Toomer Franklyn A
Create a Home Valuation Report for This Property
The Home Valuation Report is an in-depth analysis detailing your home's value as well as a comparison with similar homes in the area
Home Values in the Area
Average Home Value in this Area
Purchase History
| Date | Buyer | Sale Price | Title Company |
|---|---|---|---|
| Estevez Alexandra | $652,500 | Elite Title | |
| Marex Mark | $1,310,000 | Evident Title Agency Inc | |
| Toomer Franklyn A | $272,000 | -- | |
| Toomer Franklyn A | $272,000 | -- |
Source: Public Records
Mortgage History
| Date | Status | Borrower | Loan Amount |
|---|---|---|---|
| Open | Estevez Alexandra | $486,000 | |
| Previous Owner | Marex Mark | $1,048,000 |
Source: Public Records
Tax History Compared to Growth
Tax History
| Year | Tax Paid | Tax Assessment Tax Assessment Total Assessment is a certain percentage of the fair market value that is determined by local assessors to be the total taxable value of land and additions on the property. | Land | Improvement |
|---|---|---|---|---|
| 2025 | $13,287 | $356,500 | $110,200 | $246,300 |
| 2024 | $13,287 | $356,500 | $110,200 | $246,300 |
| 2022 | $12,356 | $356,500 | $110,200 | $246,300 |
| 2021 | $15,947 | $275,900 | $53,300 | $222,600 |
| 2020 | $15,470 | $275,900 | $53,300 | $222,600 |
| 2019 | $14,664 | $275,900 | $53,300 | $222,600 |
| 2018 | $14,430 | $275,900 | $53,300 | $222,600 |
| 2017 | $13,436 | $275,900 | $53,300 | $222,600 |
| 2016 | $13,183 | $275,900 | $53,300 | $222,600 |
| 2015 | $12,838 | $275,900 | $53,300 | $222,600 |
| 2014 | $12,025 | $275,900 | $53,300 | $222,600 |
Source: Public Records
Map
Nearby Homes