Estimated Value: $121,927 - $182,000
--
Bed
1
Bath
1,248
Sq Ft
$118/Sq Ft
Est. Value
About This Home
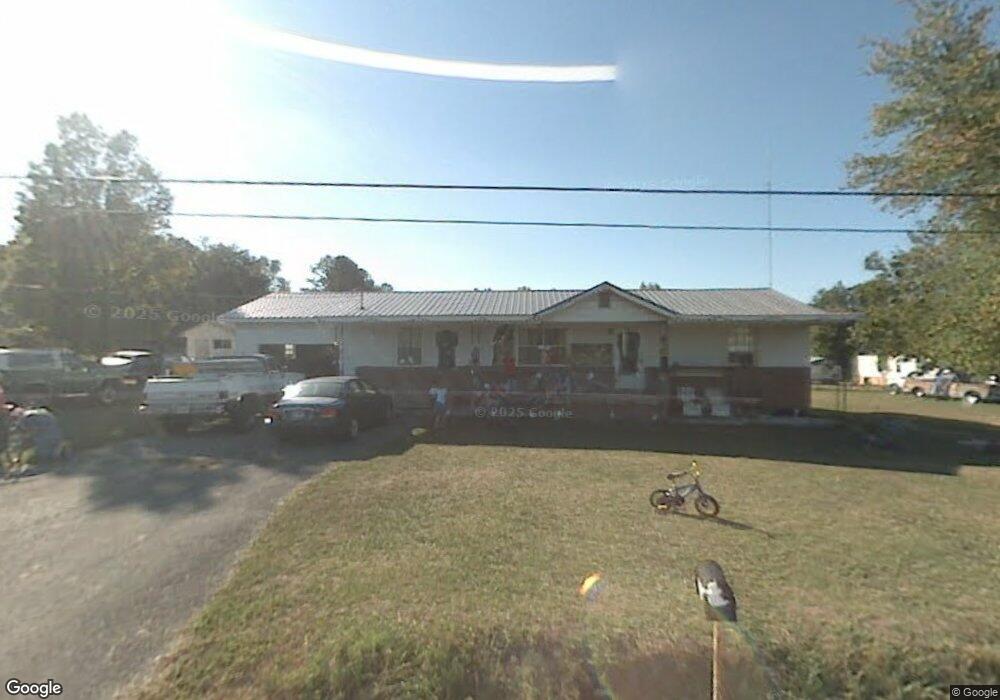
This home is located at 739 Chandler Rd, Trion, GA 30753 and is currently estimated at $147,232, approximately $117 per square foot. 739 Chandler Rd is a home located in Chattooga County with nearby schools including Chattooga High School.
Ownership History
Date
Name
Owned For
Owner Type
Purchase Details
Closed on
Dec 15, 2017
Sold by
Smith Forney W
Bought by
Smith Forney W and Smith Tonia M
Current Estimated Value
Create a Home Valuation Report for This Property
The Home Valuation Report is an in-depth analysis detailing your home's value as well as a comparison with similar homes in the area
Home Values in the Area
Average Home Value in this Area
Purchase History
| Date | Buyer | Sale Price | Title Company |
|---|---|---|---|
| Smith Forney W | -- | -- |
Source: Public Records
Tax History Compared to Growth
Tax History
| Year | Tax Paid | Tax Assessment Tax Assessment Total Assessment is a certain percentage of the fair market value that is determined by local assessors to be the total taxable value of land and additions on the property. | Land | Improvement |
|---|---|---|---|---|
| 2024 | $858 | $44,600 | $2,200 | $42,400 |
| 2023 | $1,043 | $44,600 | $2,200 | $42,400 |
| 2022 | $708 | $30,889 | $677 | $30,212 |
| 2021 | $550 | $22,677 | $820 | $21,857 |
| 2020 | $443 | $17,828 | $820 | $17,008 |
| 2019 | $447 | $17,593 | $820 | $16,773 |
| 2018 | $442 | $18,047 | $820 | $17,227 |
| 2017 | $466 | $18,047 | $820 | $17,227 |
| 2016 | $410 | $18,046 | $820 | $17,226 |
| 2015 | -- | $18,289 | $820 | $17,469 |
| 2014 | -- | $18,290 | $820 | $17,470 |
| 2013 | -- | $18,289 | $820 | $17,469 |
Source: Public Records
Map
Nearby Homes
- 456 Cummings Rd Unit C
- 456 Cummings Rd Unit D
- 456 Cummings Rd Unit B
- 456 Cummings Rd Unit E
- 132 Short Hollow Rd
- 70 Golf Course Ln
- 434 Farm Rd
- 0 Sand Pit Rd Unit 20121967
- 0 Sand Pit Rd Unit 17650016
- 22 Ninth St
- 110 Ninth St
- 1908 Old Highway 27
- 0 Ridgeway Rd Unit 1524463
- 59 10th St
- 41 Sixth St
- 0 Hwy 27 Unit 1524193
- 112 Seventh St
- 746 Thomas Rd
- 123 Airport Rd
- 151 Airport Rd
- 34 Elsie St
- 760 Chandler Rd
- 761 Chandler Rd
- 726 Chandler Rd
- 33 Elsie St
- 1198 Welcome Hill Rd
- 71 Cummings Rd
- 71 Elsie St
- 1300 Welcome Hill Rd
- 1125 Welcome Hill Rd
- 15 Carolyn St
- 45 Carolyn St
- 1331 Welcome Hill Rd
- 1114 Welcome Hill Rd
- 618 Chandler Rd
- 1007 Welcome Hill Rd
- 0 Hollow Rd Unit 1184636
- 156 Carolyn St
- 1060 Welcome Hill Rd
- 91 Chicos Trail