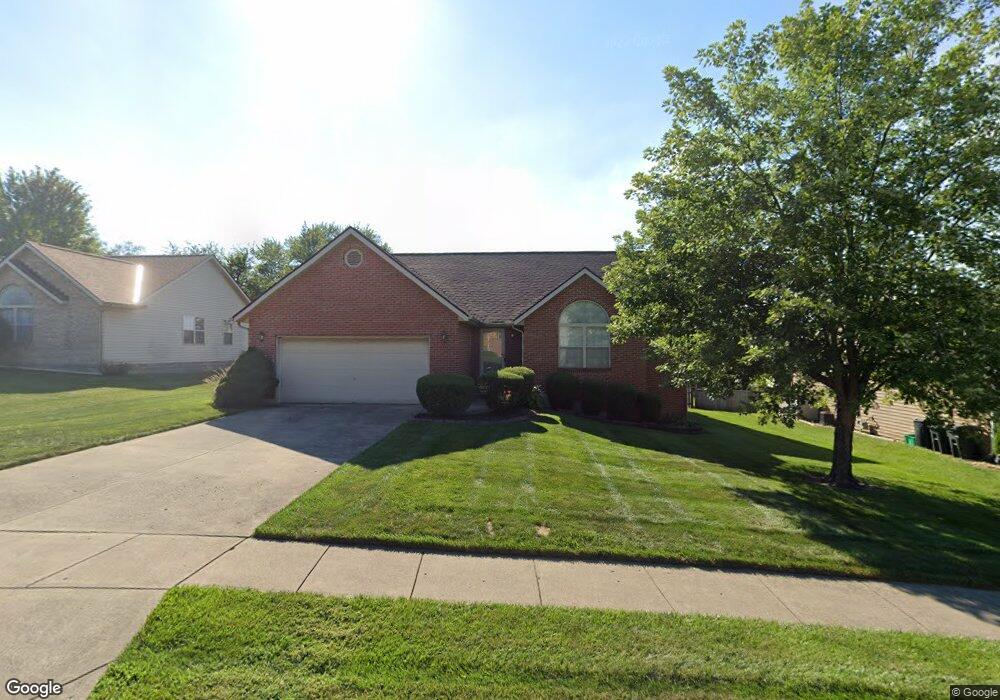
739 Davis Dr Monroe, OH 45050
Estimated Value: $329,000 - $346,810
3
Beds
2
Baths
1,680
Sq Ft
$202/Sq Ft
Est. Value
About This Home
This home is located at 739 Davis Dr, Monroe, OH 45050 and is currently estimated at $338,953, approximately $201 per square foot. 739 Davis Dr is a home located in Butler County with nearby schools including Monroe Primary School, Monroe Elementary School, and Monroe Junior High School.
Ownership History
Date
Name
Owned For
Owner Type
Purchase Details
Closed on
Jun 9, 2004
Sold by
Amaya Luis E and Amaya Abigail L
Bought by
Mendez Julio A and Mendez Clara I
Current Estimated Value
Home Financials for this Owner
Home Financials are based on the most recent Mortgage that was taken out on this home.
Original Mortgage
$130,800
Outstanding Balance
$65,903
Interest Rate
6.46%
Mortgage Type
Purchase Money Mortgage
Estimated Equity
$273,050
Purchase Details
Closed on
Nov 4, 1996
Sold by
Courtney Duff Const Co
Bought by
Amaya Luis E
Home Financials for this Owner
Home Financials are based on the most recent Mortgage that was taken out on this home.
Original Mortgage
$120,600
Interest Rate
8.23%
Mortgage Type
New Conventional
Purchase Details
Closed on
May 17, 1996
Sold by
Monroe Meadows Dev Co Lt
Bought by
Courtney Duff Const Co
Create a Home Valuation Report for This Property
The Home Valuation Report is an in-depth analysis detailing your home's value as well as a comparison with similar homes in the area
Home Values in the Area
Average Home Value in this Area
Purchase History
| Date | Buyer | Sale Price | Title Company |
|---|---|---|---|
| Mendez Julio A | $163,500 | Republic Title Agency Inc | |
| Amaya Luis E | $134,000 | -- | |
| Courtney Duff Const Co | $23,900 | -- |
Source: Public Records
Mortgage History
| Date | Status | Borrower | Loan Amount |
|---|---|---|---|
| Open | Mendez Julio A | $130,800 | |
| Closed | Amaya Luis E | $120,600 |
Source: Public Records
Tax History Compared to Growth
Tax History
| Year | Tax Paid | Tax Assessment Tax Assessment Total Assessment is a certain percentage of the fair market value that is determined by local assessors to be the total taxable value of land and additions on the property. | Land | Improvement |
|---|---|---|---|---|
| 2024 | $4,606 | $102,260 | $14,370 | $87,890 |
| 2023 | $4,576 | $103,500 | $14,370 | $89,130 |
| 2022 | $3,550 | $69,890 | $14,370 | $55,520 |
| 2021 | $3,420 | $69,890 | $14,370 | $55,520 |
| 2020 | $3,542 | $69,890 | $14,370 | $55,520 |
| 2019 | $4,026 | $58,720 | $14,960 | $43,760 |
| 2018 | $3,213 | $58,720 | $14,960 | $43,760 |
| 2017 | $3,280 | $58,720 | $14,960 | $43,760 |
| 2016 | $3,039 | $52,150 | $14,960 | $37,190 |
| 2015 | $3,005 | $52,150 | $14,960 | $37,190 |
| 2014 | $2,890 | $52,150 | $14,960 | $37,190 |
| 2013 | $2,890 | $50,560 | $10,970 | $39,590 |
Source: Public Records
Map
Nearby Homes
- 130 Stonemill Ct
- 160 Gorman Ct
- 180 Sackett Dr
- 881 Trails End Dr
- 157 Lena Dr
- 20 Stillpass Way
- 0 Wayne Madison Unit 1861405
- 201 Moder Dr
- 225 Mason Ave
- 7498 Cherokee Ln
- 857 Hocking Meadow Cir
- 95 Paddock Ln
- 856 Hocking Meadow Cir
- 32 W Elm St
- 852 Willowbrook Dr
- 589 Lebanon St
- 75 Teil Tree Ct
- 8006 Summerlin Ct
- 5167 Cincinnati Dayton Rd
- 5169 Oak Forest Dr