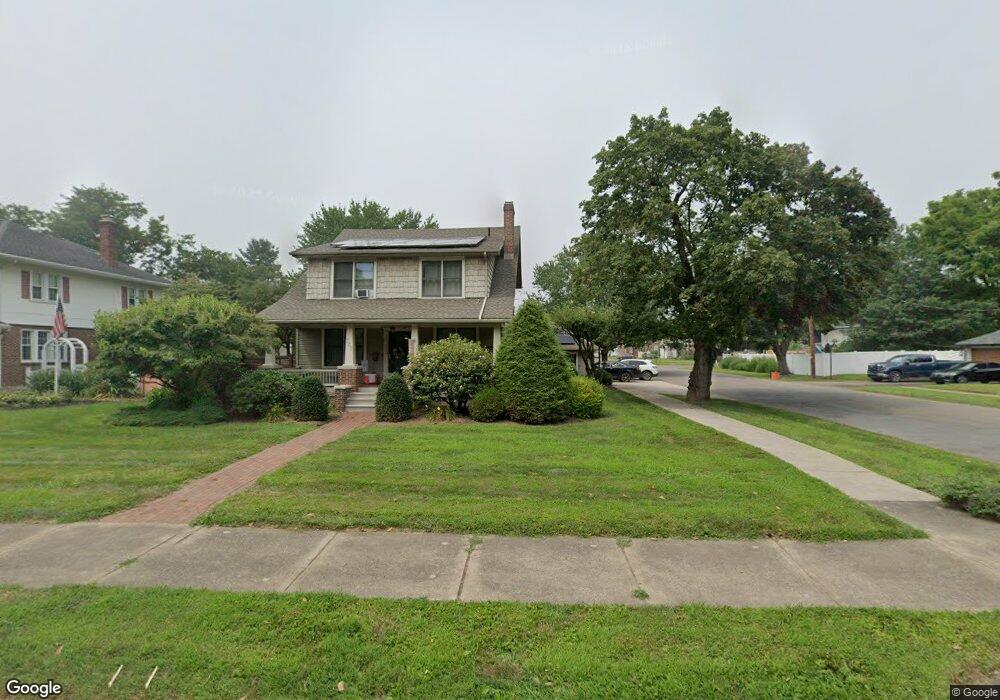
739 E 2nd St Berwick, PA 18603
Estimated Value: $290,533 - $325,000
4
Beds
3
Baths
2,152
Sq Ft
$143/Sq Ft
Est. Value
About This Home
This home is located at 739 E 2nd St, Berwick, PA 18603 and is currently estimated at $307,633, approximately $142 per square foot. 739 E 2nd St is a home located in Luzerne County with nearby schools including Berwick Area High School, Holy Family Consolidated School, and New Story School.
Ownership History
Date
Name
Owned For
Owner Type
Purchase Details
Closed on
Jul 17, 2025
Sold by
Maliza Olga J and Loza Carlos Daniel
Bought by
Anthony Amber
Current Estimated Value
Home Financials for this Owner
Home Financials are based on the most recent Mortgage that was taken out on this home.
Original Mortgage
$259,000
Outstanding Balance
$257,431
Interest Rate
6.81%
Mortgage Type
New Conventional
Estimated Equity
$50,202
Purchase Details
Closed on
Mar 29, 2019
Sold by
Tri & Ngoc Properties Llc
Bought by
Maliza Olga J
Home Financials for this Owner
Home Financials are based on the most recent Mortgage that was taken out on this home.
Original Mortgage
$188,522
Interest Rate
4.5%
Mortgage Type
FHA
Purchase Details
Closed on
Sep 16, 2015
Sold by
The Bank Of New York Mellon Trust Compan
Bought by
Tri & Ngoc Properties Llc
Purchase Details
Closed on
Jan 27, 2015
Sold by
Digiondomenico Nancy C and Digiondomenico Ronald V
Bought by
The Bank Of New Yokr Mellon Trust Compan
Purchase Details
Closed on
Sep 2, 1987
Bought by
Digiondomenico Ronald and Digiondomenico Nancy
Create a Home Valuation Report for This Property
The Home Valuation Report is an in-depth analysis detailing your home's value as well as a comparison with similar homes in the area
Home Values in the Area
Average Home Value in this Area
Purchase History
| Date | Buyer | Sale Price | Title Company |
|---|---|---|---|
| Anthony Amber | $295,000 | None Listed On Document | |
| Maliza Olga J | $192,000 | None Available | |
| Tri & Ngoc Properties Llc | $110,000 | None Available | |
| The Bank Of New Yokr Mellon Trust Compan | $1,289 | None Available | |
| Digiondomenico Ronald | $8,500 | -- |
Source: Public Records
Mortgage History
| Date | Status | Borrower | Loan Amount |
|---|---|---|---|
| Open | Anthony Amber | $259,000 | |
| Previous Owner | Maliza Olga J | $188,522 |
Source: Public Records
Tax History
| Year | Tax Paid | Tax Assessment Tax Assessment Total Assessment is a certain percentage of the fair market value that is determined by local assessors to be the total taxable value of land and additions on the property. | Land | Improvement |
|---|---|---|---|---|
| 2026 | $3,895 | $170,600 | $36,900 | $133,700 |
| 2025 | $3,842 | $170,600 | $36,900 | $133,700 |
| 2024 | $3,727 | $170,600 | $36,900 | $133,700 |
| 2023 | $3,578 | $170,600 | $36,900 | $133,700 |
| 2022 | $3,547 | $170,600 | $36,900 | $133,700 |
| 2021 | $3,547 | $170,600 | $36,900 | $133,700 |
| 2020 | $3,064 | $170,600 | $36,900 | $133,700 |
| 2019 | $3,041 | $170,600 | $36,900 | $133,700 |
| 2018 | $3,019 | $170,600 | $36,900 | $133,700 |
| 2017 | $3,157 | $170,600 | $36,900 | $133,700 |
| 2016 | -- | $170,600 | $36,900 | $133,700 |
| 2015 | -- | $170,600 | $36,900 | $133,700 |
| 2014 | -- | $170,600 | $36,900 | $133,700 |
Source: Public Records
Map
Nearby Homes
Your Personal Tour Guide
Ask me questions while you tour the home.