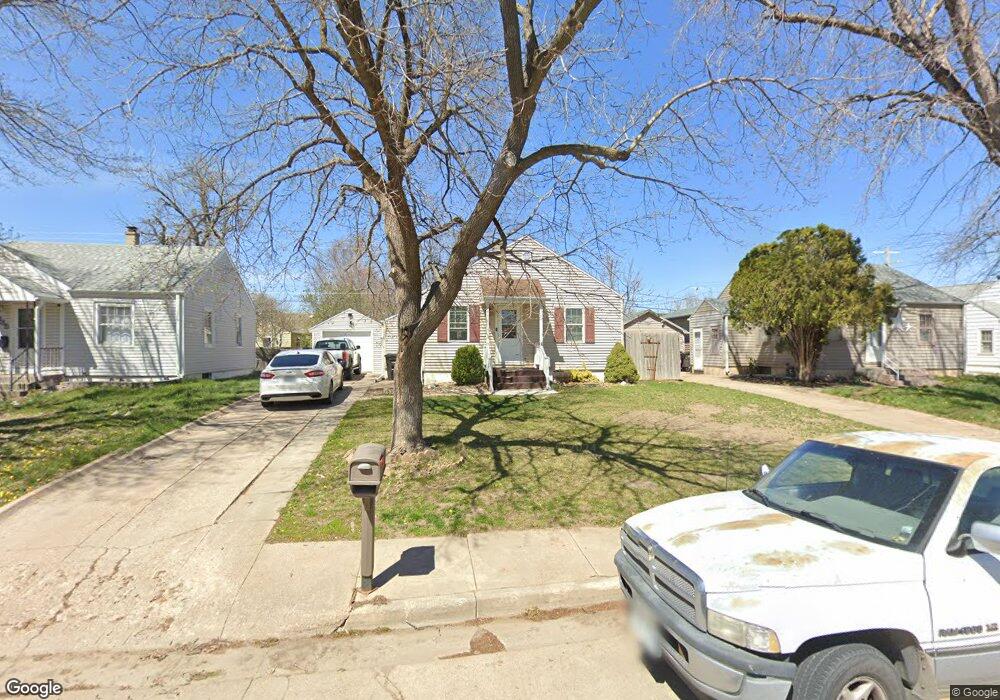
739 E 3rd St Hastings, NE 68901
Estimated Value: $126,000 - $161,000
3
Beds
1
Bath
626
Sq Ft
$240/Sq Ft
Est. Value
About This Home
This home is located at 739 E 3rd St, Hastings, NE 68901 and is currently estimated at $150,230, approximately $239 per square foot. 739 E 3rd St is a home located in Adams County with nearby schools including Hastings Senior High School, St. Michael's Preschool & Elementary School, and St. Cecilia High School.
Ownership History
Date
Name
Owned For
Owner Type
Purchase Details
Closed on
Feb 12, 2020
Sold by
Seamann Nicole A
Bought by
Murthy Sheela
Current Estimated Value
Home Financials for this Owner
Home Financials are based on the most recent Mortgage that was taken out on this home.
Original Mortgage
$96,030
Outstanding Balance
$84,502
Interest Rate
3.72%
Mortgage Type
Purchase Money Mortgage
Estimated Equity
$65,728
Purchase Details
Closed on
Feb 28, 2018
Sold by
Morehead Macie J and Morehead Joshua J
Bought by
Seamann Nicole
Home Financials for this Owner
Home Financials are based on the most recent Mortgage that was taken out on this home.
Original Mortgage
$94,751
Interest Rate
4.5%
Mortgage Type
FHA
Purchase Details
Closed on
Jun 2, 2014
Sold by
Tripe Nicholas J and Tripe Kimberly A
Bought by
Kiiker Marcie J
Create a Home Valuation Report for This Property
The Home Valuation Report is an in-depth analysis detailing your home's value as well as a comparison with similar homes in the area
Home Values in the Area
Average Home Value in this Area
Purchase History
| Date | Buyer | Sale Price | Title Company |
|---|---|---|---|
| Murthy Sheela | $99,000 | None Available | |
| Seamann Nicole | $97,000 | -- | |
| Kiiker Marcie J | $78,000 | Elizabeth Prairie Title |
Source: Public Records
Mortgage History
| Date | Status | Borrower | Loan Amount |
|---|---|---|---|
| Open | Murthy Sheela | $96,030 | |
| Previous Owner | Seamann Nicole | $94,751 |
Source: Public Records
Tax History
| Year | Tax Paid | Tax Assessment Tax Assessment Total Assessment is a certain percentage of the fair market value that is determined by local assessors to be the total taxable value of land and additions on the property. | Land | Improvement |
|---|---|---|---|---|
| 2025 | $1,790 | $114,480 | $14,754 | $99,726 |
| 2024 | $1,594 | $99,370 | $14,754 | $84,616 |
| 2023 | $1,895 | $91,815 | $14,754 | $77,061 |
| 2022 | $1,655 | $73,478 | $14,754 | $58,724 |
| 2021 | $1,494 | $68,136 | $9,412 | $58,724 |
| 2020 | $1,409 | $65,340 | $9,412 | $55,928 |
| 2019 | $1,337 | $62,677 | $9,412 | $53,265 |
| 2018 | $1,257 | $58,605 | $5,340 | $53,265 |
| 2017 | $1,256 | $58,605 | $0 | $0 |
| 2016 | $966 | $45,030 | $5,340 | $39,690 |
| 2011 | -- | $42,145 | $5,090 | $37,055 |
Source: Public Records
Map
Nearby Homes
- 747 E 2nd St
- 724 E 5th St
- 730 E 6th St
- 907 E 6th St
- 803 E 7th St
- 519 E 7th St
- 611 Thomas Dr Unit 611
- 211 S California Ave
- 1007 University Ave
- 214 E 7th St
- 1210 University St
- 411 University Ave
- 8 Durwood Ln
- 1120 Pleasant St
- 2 Sara Dr
- 117 E 6th St
- 1303 Pleasant St
- 1 Windsor Dr
- 12 Avalon Ln
- 312 N Colorado Ave
Your Personal Tour Guide
Ask me questions while you tour the home.