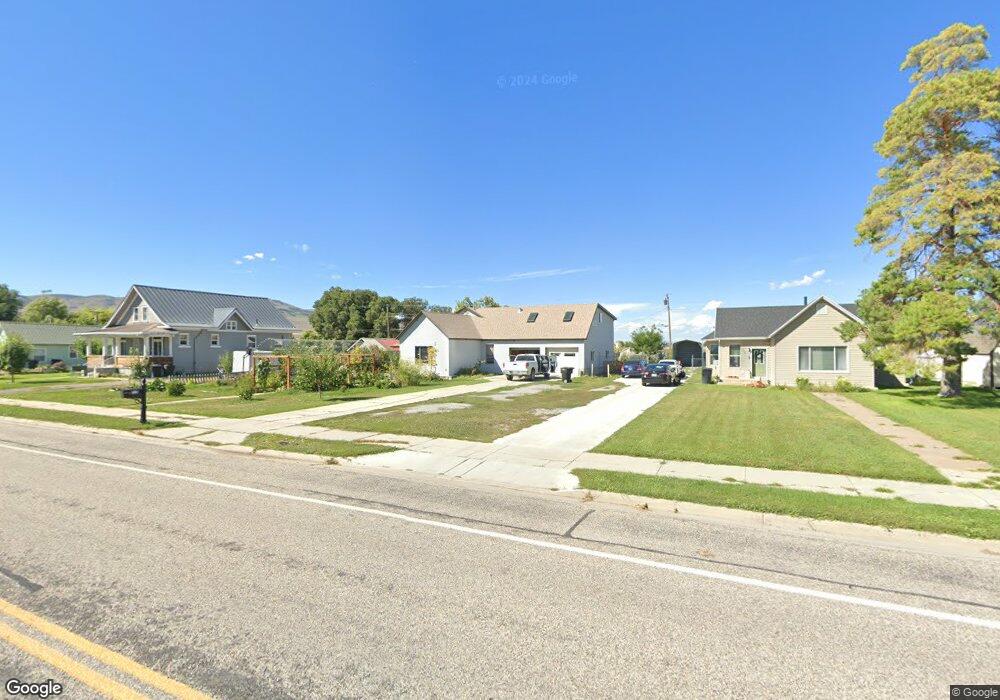
739 E Factory St Garland, UT 84312
Estimated Value: $354,000 - $438,000
4
Beds
2
Baths
2,470
Sq Ft
$159/Sq Ft
Est. Value
About This Home
This home is located at 739 E Factory St, Garland, UT 84312 and is currently estimated at $391,936, approximately $158 per square foot. 739 E Factory St is a home located in Box Elder County with nearby schools including Fielding School, Bear River Middle School, and Alice C. Harris Intermediate School.
Ownership History
Date
Name
Owned For
Owner Type
Purchase Details
Closed on
Sep 18, 2021
Sold by
Montgomery Nicolaus Bo
Bought by
Montgomery Nicolaus Bo and Montgomery Amy Kaye
Current Estimated Value
Home Financials for this Owner
Home Financials are based on the most recent Mortgage that was taken out on this home.
Original Mortgage
$156,100
Outstanding Balance
$142,039
Interest Rate
2.8%
Mortgage Type
New Conventional
Estimated Equity
$249,897
Purchase Details
Closed on
Aug 5, 2017
Sold by
Roberts Jim W and Roberts Rachel A
Bought by
Montgomery Nicolaus Bo
Home Financials for this Owner
Home Financials are based on the most recent Mortgage that was taken out on this home.
Original Mortgage
$162,011
Interest Rate
3.75%
Mortgage Type
FHA
Purchase Details
Closed on
Jun 5, 2009
Sold by
Roberts Jim
Bought by
Roberts Jim W and Roberts Rachel A
Purchase Details
Closed on
May 7, 2008
Sold by
Free Enterprises Synstems Llc
Bought by
Roberts Jim
Create a Home Valuation Report for This Property
The Home Valuation Report is an in-depth analysis detailing your home's value as well as a comparison with similar homes in the area
Home Values in the Area
Average Home Value in this Area
Purchase History
| Date | Buyer | Sale Price | Title Company |
|---|---|---|---|
| Montgomery Nicolaus Bo | -- | Amrock Llc | |
| Montgomery Nicolaus Bo | -- | Tooele Title Company | |
| Roberts Jim W | -- | -- | |
| Roberts Jim | -- | -- |
Source: Public Records
Mortgage History
| Date | Status | Borrower | Loan Amount |
|---|---|---|---|
| Open | Montgomery Nicolaus Bo | $156,100 | |
| Closed | Montgomery Nicolaus Bo | $162,011 |
Source: Public Records
Tax History Compared to Growth
Tax History
| Year | Tax Paid | Tax Assessment Tax Assessment Total Assessment is a certain percentage of the fair market value that is determined by local assessors to be the total taxable value of land and additions on the property. | Land | Improvement |
|---|---|---|---|---|
| 2025 | $2,023 | $351,993 | $105,000 | $246,993 |
| 2024 | $2,023 | $347,270 | $100,000 | $247,270 |
| 2023 | $1,893 | $320,581 | $90,000 | $230,581 |
| 2022 | $1,697 | $148,191 | $13,750 | $134,441 |
| 2021 | $1,576 | $184,633 | $25,000 | $159,633 |
| 2020 | $1,328 | $184,633 | $25,000 | $159,633 |
| 2019 | $1,241 | $91,447 | $13,750 | $77,697 |
| 2018 | $995 | $68,532 | $13,750 | $54,782 |
| 2017 | $1,033 | $124,603 | $13,750 | $99,603 |
| 2016 | $977 | $65,923 | $13,750 | $52,173 |
| 2015 | $913 | $61,180 | $13,750 | $47,430 |
| 2014 | $913 | $58,922 | $13,750 | $45,172 |
| 2013 | -- | $39,108 | $13,338 | $25,770 |
Source: Public Records
Map
Nearby Homes
- 713 E Factory St
- 779 E Factory St
- 797 E Factory St
- 797 E Factory St
- 675 E Factory St
- 809 E Factory St
- 740 E Factory St
- 716 E Factory St
- 786 E Factory St
- 665 E Factory St Unit 97
- 686 E Factory St Unit 166
- 839 E Factory St
- 839 E Factory St
- 663 E Factory St
- 802 E Factory St Unit 3
- 662 E Factory St
- 631 E Factory St
- 828 E Factory Garland Ut
- 869 E Factory St
- 844 E Factory St