Estimated Value: $291,000 - $418,000
4
Beds
1
Bath
1,670
Sq Ft
$208/Sq Ft
Est. Value
About This Home
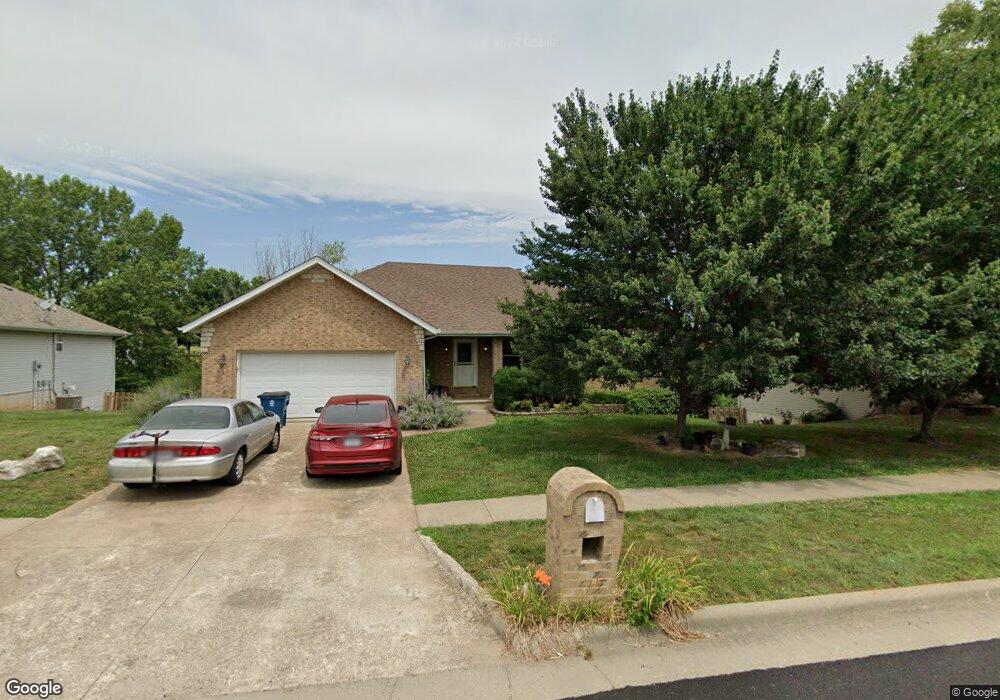
This home is located at 739 E Gallup Hill Rd, Nixa, MO 65714 and is currently estimated at $346,647, approximately $207 per square foot. 739 E Gallup Hill Rd is a home with nearby schools including Summit Intermediate School, Century Elementary School, and Nixa Junior High School.
Ownership History
Date
Name
Owned For
Owner Type
Purchase Details
Closed on
May 4, 2015
Sold by
Russell Amy N
Bought by
Russell Amy N and Keith Robinette L
Current Estimated Value
Purchase Details
Closed on
Oct 24, 2014
Sold by
Russell Scott A
Bought by
Russell Amy N
Purchase Details
Closed on
Jul 16, 2007
Sold by
Mabe Terry and Mabe Beverly
Bought by
Russell Scott
Home Financials for this Owner
Home Financials are based on the most recent Mortgage that was taken out on this home.
Original Mortgage
$152,500
Outstanding Balance
$94,558
Interest Rate
6.71%
Mortgage Type
New Conventional
Estimated Equity
$252,089
Purchase Details
Closed on
May 12, 2005
Sold by
Mabe Bob J and Mabe Sue
Bought by
Mabe Terry and Mabe Beverly
Home Financials for this Owner
Home Financials are based on the most recent Mortgage that was taken out on this home.
Original Mortgage
$163,917
Interest Rate
3%
Mortgage Type
Adjustable Rate Mortgage/ARM
Create a Home Valuation Report for This Property
The Home Valuation Report is an in-depth analysis detailing your home's value as well as a comparison with similar homes in the area
Home Values in the Area
Average Home Value in this Area
Purchase History
| Date | Buyer | Sale Price | Title Company |
|---|---|---|---|
| Russell Amy N | -- | Fidelity Title Agency | |
| Russell Amy N | -- | None Available | |
| Russell Scott | -- | None Available | |
| Mabe Terry | -- | None Available | |
| Mabe Bob J | -- | None Available |
Source: Public Records
Mortgage History
| Date | Status | Borrower | Loan Amount |
|---|---|---|---|
| Open | Russell Scott | $152,500 | |
| Previous Owner | Mabe Bob J | $163,917 |
Source: Public Records
Tax History
| Year | Tax Paid | Tax Assessment Tax Assessment Total Assessment is a certain percentage of the fair market value that is determined by local assessors to be the total taxable value of land and additions on the property. | Land | Improvement |
|---|---|---|---|---|
| 2025 | $2,404 | $42,560 | -- | -- |
| 2024 | $2,404 | $38,570 | -- | -- |
| 2023 | $2,404 | $38,570 | $0 | $0 |
| 2022 | $2,300 | $36,860 | $0 | $0 |
| 2021 | $2,301 | $36,860 | $0 | $0 |
| 2020 | $2,134 | $32,620 | $0 | $0 |
| 2019 | $2,134 | $32,620 | $0 | $0 |
| 2018 | $1,988 | $32,620 | $0 | $0 |
| 2017 | $1,988 | $32,620 | $0 | $0 |
| 2016 | $1,901 | $31,690 | $0 | $0 |
| 2015 | $1,904 | $31,690 | $31,690 | $0 |
| 2014 | $1,855 | $31,650 | $0 | $0 |
| 2013 | $19 | $31,650 | $0 | $0 |
| 2011 | $19 | $63,300 | $0 | $0 |
Source: Public Records
Map
Nearby Homes
- 601 Carriage Crossing
- 577 S Canterbury Ln
- 985 Crimson Ave
- 573 Barn Stable
- 838 E Crystal Ave
- 838 & 840 E Crystal Ave
- 840 E Crystal Ave
- 858 E Richmond Way
- 721 Oak Terrace Dr
- 723 S Oak Terrace Dr
- 750 Rippling Creek Rd
- 512 Baldknobber St
- 718 S Peach Brook
- 854 E Acacia Ln
- 822 S Eastridge
- 640 E Spring Valley Cir Unit 1
- 116 E Acacia Ln
- 120 E Acacia Ln
- 106 E Acacia Ln
- 823 S Ridgemont Dr Unit Lot 213
- 737 E Gallup Hill Rd
- 741 E Gallup Hill Rd
- 740 E Gallup Hill Rd
- 735 E Gallup Hill Rd
- 748 Notting Hill Gate
- 738 E Gallup Hill Rd
- 754 Notting Hill Gate
- 760 Notting Hill Gate
- 740 Notting Hill Gate
- 603 S Eastridge
- 733 E Gallup Hill Rd
- 605 S Eastridge
- 608 S Bishops Ct
- 768 Notting Hill Gate
- 745 E Gallup Hill Rd
- 605 Bishops Ct
- 607 S Eastridge
- 734 Notting Hill Gate
- 578 Lantern Hill
- 731 E Gallup Hill Rd
Your Personal Tour Guide
Ask me questions while you tour the home.