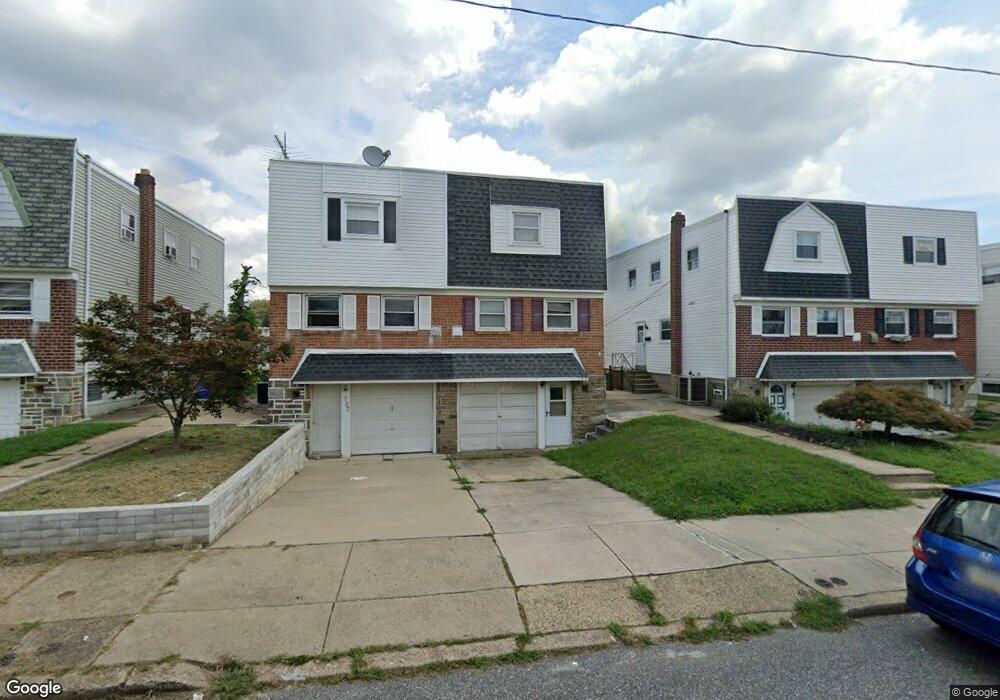
739 Gorman St Philadelphia, PA 19116
Somerton NeighborhoodEstimated Value: $346,000 - $355,435
3
Beds
3
Baths
1,310
Sq Ft
$267/Sq Ft
Est. Value
About This Home
This home is located at 739 Gorman St, Philadelphia, PA 19116 and is currently estimated at $349,359, approximately $266 per square foot. 739 Gorman St is a home located in Philadelphia County with nearby schools including Loesche William H School, CCA Baldi Middle School, and George Washington High School.
Ownership History
Date
Name
Owned For
Owner Type
Purchase Details
Closed on
Feb 24, 2005
Sold by
Rednikov Valentin and Rednikov Zoya
Bought by
Rednikov Zoya
Current Estimated Value
Purchase Details
Closed on
May 24, 2002
Sold by
Zoya Rednikow Valentin and Zoya Goloshinska
Bought by
Rednikov Valentin and Rednikov Zoya
Home Financials for this Owner
Home Financials are based on the most recent Mortgage that was taken out on this home.
Original Mortgage
$79,673
Interest Rate
6.9%
Mortgage Type
FHA
Purchase Details
Closed on
May 31, 1996
Sold by
Hedgepeth Robert L and Hedgepeth Linda A
Bought by
Rednikov Valentin and Goloshinskaya Zoya
Purchase Details
Closed on
Apr 13, 1995
Sold by
Resolution Trust Corp
Bought by
Hedgepeth Robert L
Purchase Details
Closed on
Apr 12, 1995
Sold by
Resolution Trust Corp
Bought by
Resolution Trust Corp and City Fsb
Purchase Details
Closed on
Jan 17, 1994
Sold by
Green John D
Bought by
Resolution Trust Corp
Create a Home Valuation Report for This Property
The Home Valuation Report is an in-depth analysis detailing your home's value as well as a comparison with similar homes in the area
Home Values in the Area
Average Home Value in this Area
Purchase History
| Date | Buyer | Sale Price | Title Company |
|---|---|---|---|
| Rednikov Zoya | -- | -- | |
| Rednikov Valentin | -- | First American Title Ins Co | |
| Rednikov Valentin | $80,000 | -- | |
| Hedgepeth Robert L | $71,000 | -- | |
| Resolution Trust Corp | -- | -- | |
| Resolution Trust Corp | $5,600 | -- |
Source: Public Records
Mortgage History
| Date | Status | Borrower | Loan Amount |
|---|---|---|---|
| Previous Owner | Rednikov Valentin | $79,673 |
Source: Public Records
Tax History Compared to Growth
Tax History
| Year | Tax Paid | Tax Assessment Tax Assessment Total Assessment is a certain percentage of the fair market value that is determined by local assessors to be the total taxable value of land and additions on the property. | Land | Improvement |
|---|---|---|---|---|
| 2025 | $3,656 | $322,000 | $64,400 | $257,600 |
| 2024 | $3,656 | $322,000 | $64,400 | $257,600 |
| 2023 | $3,656 | $261,200 | $52,240 | $208,960 |
| 2022 | $2,039 | $216,200 | $52,240 | $163,960 |
| 2021 | $2,858 | $0 | $0 | $0 |
| 2020 | $2,858 | $0 | $0 | $0 |
| 2019 | $2,692 | $0 | $0 | $0 |
| 2018 | $2,550 | $0 | $0 | $0 |
| 2017 | $2,550 | $0 | $0 | $0 |
| 2016 | $2,039 | $0 | $0 | $0 |
| 2015 | $2,039 | $0 | $0 | $0 |
| 2014 | -- | $182,200 | $53,854 | $128,346 |
| 2012 | -- | $22,528 | $2,844 | $19,684 |
Source: Public Records
Map
Nearby Homes
- 10076 Jeanes St
- 770 Selmer Rd
- 10236 Selmer Terrace
- 9999 Woodfern Rd
- 1120 Chesworth Rd
- 10236 Jeanes St
- 630 Lawler Place
- 9967 Verree Rd
- 10103 Northeast Ave Unit 9
- 9962 Woodfern Rd
- 9959 Ferndale St
- 9945 Jeanes St
- 9908 00 Bustleton Ave Unit F9
- 9949 Woodfern Rd
- 831 Lawler St
- 9933 Medway Rd
- 412 Avon Place
- 10665 Halstead St
- 9921 Bustleton Ave Unit P3
- 1207 Friel Place
- 737 Gorman St
- 741 Gorman St
- 735 Gorman St
- 743 Gorman St
- 733 Gorman St
- 745 Gorman St
- 731 Gorman St
- 747 Gorman St
- 736 Greymont St
- 738 Greymont St
- 740 Greymont St
- 734 Greymont St
- 732 Greymont St
- 749 Gorman St
- 742 Greymont St
- 730 Greymont St
- 727 Gorman St
- 751 Gorman St
- 10039 Bridle Rd
- 10039 Bridle Rd Unit 2ND FLOOR