Estimated Value: $95,000 - $155,000
3
Beds
1
Bath
1,176
Sq Ft
$114/Sq Ft
Est. Value
About This Home
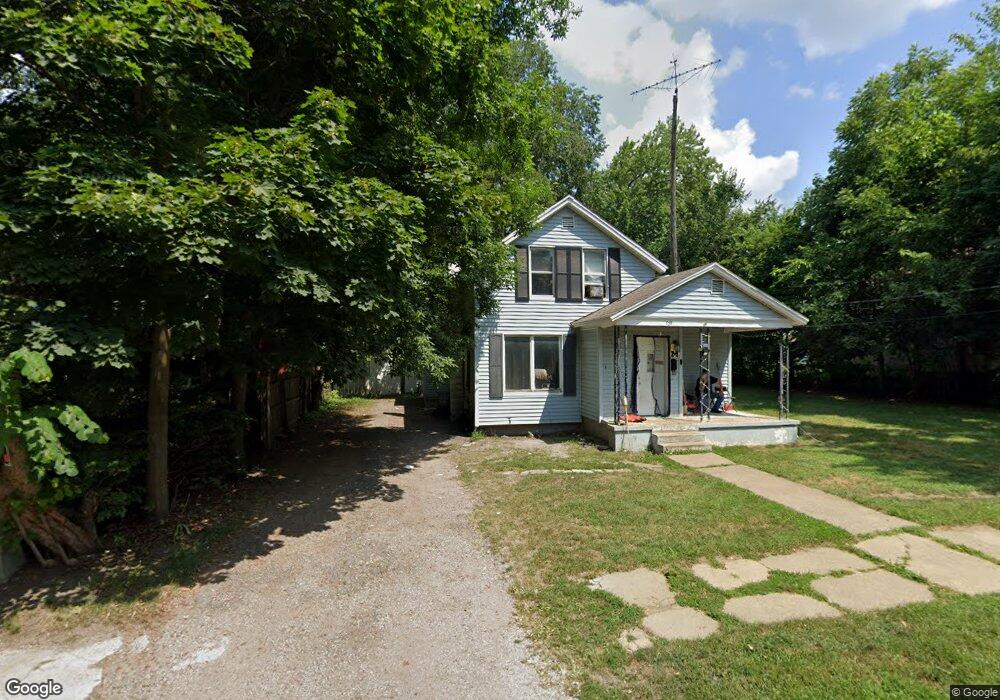
This home is located at 739 Hickory St, Niles, MI 49120 and is currently estimated at $134,141, approximately $114 per square foot. 739 Hickory St is a home located in Berrien County with nearby schools including Ballard Elementary School, Oak Manor Sixth Grade Center, and Ring Lardner Middle School.
Ownership History
Date
Name
Owned For
Owner Type
Purchase Details
Closed on
May 25, 2011
Sold by
Secretary Of Housing & Urban Development
Bought by
Fritz Kirt
Current Estimated Value
Purchase Details
Closed on
Jun 23, 2010
Sold by
Citimortgage Inc
Bought by
Secretary Of Housing & Urban Development
Purchase Details
Closed on
Mar 18, 2010
Sold by
Joyner Sarah and Place David
Bought by
Citimortgage Llc
Purchase Details
Closed on
Jun 14, 2000
Purchase Details
Closed on
Jul 7, 1998
Purchase Details
Closed on
Nov 20, 1997
Purchase Details
Closed on
Jan 29, 1996
Purchase Details
Closed on
Jan 15, 1994
Purchase Details
Closed on
Dec 18, 1989
Purchase Details
Closed on
Dec 27, 1985
Purchase Details
Closed on
Jun 24, 1983
Create a Home Valuation Report for This Property
The Home Valuation Report is an in-depth analysis detailing your home's value as well as a comparison with similar homes in the area
Home Values in the Area
Average Home Value in this Area
Purchase History
| Date | Buyer | Sale Price | Title Company |
|---|---|---|---|
| Fritz Kirt | $13,440 | None Available | |
| Secretary Of Housing & Urban Development | -- | None Available | |
| Citimortgage Llc | $70,976 | None Available | |
| -- | $65,800 | -- | |
| -- | $100 | -- | |
| -- | $100 | -- | |
| -- | $100 | -- | |
| -- | $42,900 | -- | |
| -- | $12,500 | -- | |
| -- | -- | -- | |
| -- | $12,500 | -- |
Source: Public Records
Tax History Compared to Growth
Tax History
| Year | Tax Paid | Tax Assessment Tax Assessment Total Assessment is a certain percentage of the fair market value that is determined by local assessors to be the total taxable value of land and additions on the property. | Land | Improvement |
|---|---|---|---|---|
| 2025 | $1,613 | $68,400 | $0 | $0 |
| 2024 | $850 | $62,800 | $0 | $0 |
| 2023 | $815 | $54,900 | $0 | $0 |
| 2022 | $776 | $51,300 | $0 | $0 |
| 2021 | $1,414 | $47,800 | $5,200 | $42,600 |
| 2020 | $1,397 | $36,700 | $0 | $0 |
| 2019 | $1,377 | $37,500 | $14,100 | $23,400 |
| 2018 | $1,327 | $37,500 | $0 | $0 |
| 2017 | $1,312 | $27,800 | $0 | $0 |
| 2016 | $1,290 | $25,800 | $0 | $0 |
| 2015 | $1,286 | $24,400 | $0 | $0 |
| 2014 | $674 | $24,300 | $0 | $0 |
Source: Public Records
Map
Nearby Homes
- 705 Oak St
- 712 Maple St
- 1008 Oak St
- 319 S 5th St
- 211 S 4th St
- 921 Cedar St
- 1121 Broadway St
- VL Huron St
- 709 Regent St
- 211 N 8th St
- 1648 Oak St
- 810 Ferry St
- 1314 Ferry St
- 1407 Hickory St
- 1123 N 9th St
- 212 Clay St
- 21 S 15th St
- Integrity 1610 Plan at Carefree Villas
- Integrity 1605 Plan at Carefree Villas
- Integrity 1250 Plan at Carefree Villas