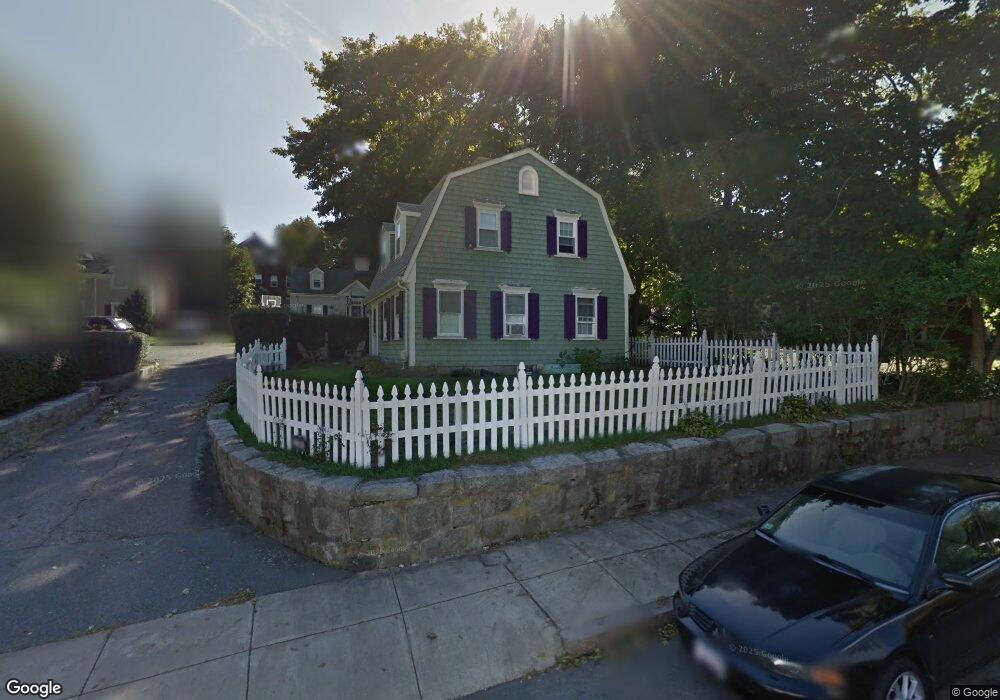
739 High St Fall River, MA 02720
Lower Highlands NeighborhoodEstimated Value: $359,000 - $444,000
3
Beds
1
Bath
1,268
Sq Ft
$317/Sq Ft
Est. Value
About This Home
This home is located at 739 High St, Fall River, MA 02720 and is currently estimated at $402,557, approximately $317 per square foot. 739 High St is a home located in Bristol County with nearby schools including Mary Fonseca Elementary School, Morton Middle School, and B M C Durfee High School.
Ownership History
Date
Name
Owned For
Owner Type
Purchase Details
Closed on
Jul 30, 1998
Sold by
Wrobel Thomas M and Wrobel Cecilia T
Bought by
Bauer Ronald G and Bauer Catarina I
Current Estimated Value
Create a Home Valuation Report for This Property
The Home Valuation Report is an in-depth analysis detailing your home's value as well as a comparison with similar homes in the area
Home Values in the Area
Average Home Value in this Area
Purchase History
| Date | Buyer | Sale Price | Title Company |
|---|---|---|---|
| Bauer Ronald G | $106,000 | -- |
Source: Public Records
Mortgage History
| Date | Status | Borrower | Loan Amount |
|---|---|---|---|
| Open | Bauer Ronald G | $165,000 | |
| Closed | Bauer Ronald G | $30,000 |
Source: Public Records
Tax History
| Year | Tax Paid | Tax Assessment Tax Assessment Total Assessment is a certain percentage of the fair market value that is determined by local assessors to be the total taxable value of land and additions on the property. | Land | Improvement |
|---|---|---|---|---|
| 2025 | $3,418 | $298,500 | $114,400 | $184,100 |
| 2024 | $3,242 | $282,200 | $112,200 | $170,000 |
| 2023 | $3,199 | $260,700 | $101,100 | $159,600 |
| 2022 | $2,884 | $228,500 | $95,400 | $133,100 |
| 2021 | $2,839 | $205,300 | $91,100 | $114,200 |
| 2020 | $2,802 | $193,900 | $87,000 | $106,900 |
| 2019 | $2,823 | $193,600 | $90,900 | $102,700 |
| 2018 | $2,751 | $188,200 | $89,400 | $98,800 |
| 2017 | $2,611 | $186,500 | $89,400 | $97,100 |
| 2016 | $2,528 | $185,500 | $94,100 | $91,400 |
| 2015 | $2,426 | $185,500 | $94,100 | $91,400 |
| 2014 | $2,334 | $185,500 | $94,100 | $91,400 |
Source: Public Records
Map
Nearby Homes
- 267 Lincoln Ave
- 72 Belmont St
- 889 High St
- 909 High St Unit 1
- 503 Highland Ave
- 499 Maple St
- 575 N Main St
- 11 Dyer St
- 499 Hanover St
- 450 Rock St Unit 1
- 65 Bigelow St
- 610 Walnut St
- 360 High St
- 126 June St
- 631 Walnut St
- 327 Brownell St
- 339 Danforth St Unit 6
- 337 Danforth St Unit 7
- 33-35 Malvey St
- 545 Robeson St
Your Personal Tour Guide
Ask me questions while you tour the home.