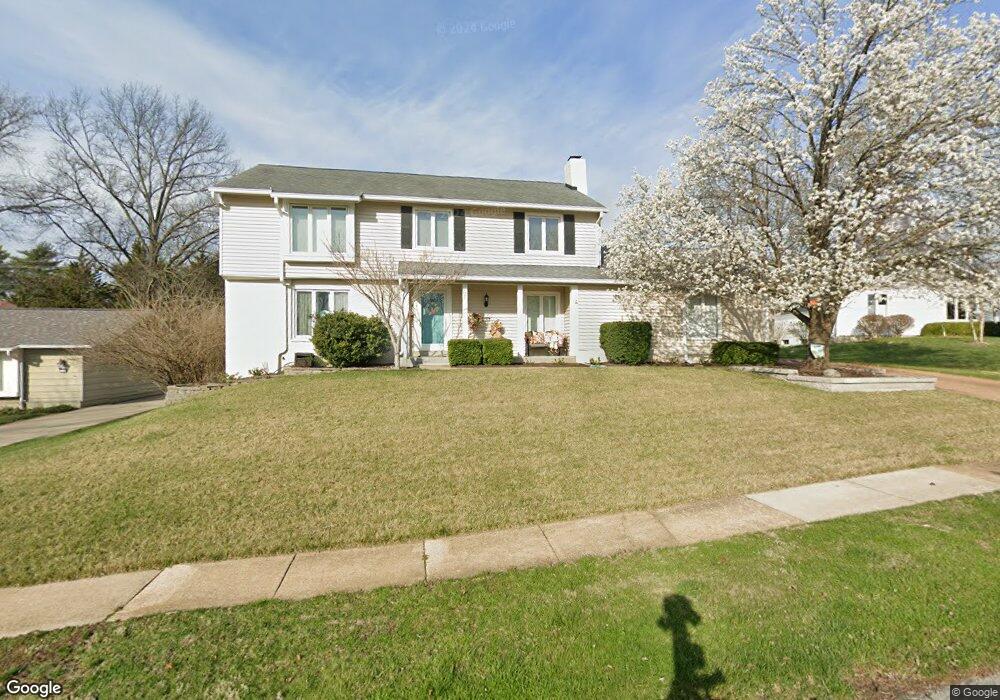
739 Jares Ct Ballwin, MO 63011
Estimated Value: $450,943 - $525,000
4
Beds
3
Baths
2,280
Sq Ft
$216/Sq Ft
Est. Value
About This Home
This home is located at 739 Jares Ct, Ballwin, MO 63011 and is currently estimated at $492,236, approximately $215 per square foot. 739 Jares Ct is a home located in St. Louis County with nearby schools including Henry Elementary School, Parkway West Middle School, and Parkway West High School.
Ownership History
Date
Name
Owned For
Owner Type
Purchase Details
Closed on
Jun 9, 2015
Sold by
Bank Colman H and Bank Diann J
Bought by
Morrow Keith D and Morrow Stephanie L
Current Estimated Value
Home Financials for this Owner
Home Financials are based on the most recent Mortgage that was taken out on this home.
Original Mortgage
$275,786
Outstanding Balance
$217,345
Interest Rate
4.25%
Mortgage Type
FHA
Estimated Equity
$274,891
Purchase Details
Closed on
Jul 2, 2014
Sold by
Bank Colman H and Bank Diann Joy
Bought by
Bank Colman H and Bank Diann J
Purchase Details
Closed on
Jul 21, 2010
Sold by
Hild Lawrence C and Hild Pamela R
Bought by
Bank Colman H and Bank Diann Joy
Home Financials for this Owner
Home Financials are based on the most recent Mortgage that was taken out on this home.
Original Mortgage
$205,600
Interest Rate
4.76%
Mortgage Type
New Conventional
Purchase Details
Closed on
Dec 28, 1999
Sold by
Hild Lawrence C and Hild Pamela
Bought by
Hild Lawrence C and Hild Pamela R
Purchase Details
Closed on
Oct 4, 1999
Sold by
Cini Thomas J and Cini Louise E
Bought by
Hild Lawrence C and Snep Pamela R
Home Financials for this Owner
Home Financials are based on the most recent Mortgage that was taken out on this home.
Original Mortgage
$158,850
Interest Rate
7.83%
Create a Home Valuation Report for This Property
The Home Valuation Report is an in-depth analysis detailing your home's value as well as a comparison with similar homes in the area
Home Values in the Area
Average Home Value in this Area
Purchase History
| Date | Buyer | Sale Price | Title Company |
|---|---|---|---|
| Morrow Keith D | $281,000 | Title Resources Inc | |
| Bank Colman H | -- | None Available | |
| Bank Colman H | $257,000 | U S Title | |
| Hild Lawrence C | -- | -- | |
| Hild Lawrence C | $186,900 | -- |
Source: Public Records
Mortgage History
| Date | Status | Borrower | Loan Amount |
|---|---|---|---|
| Open | Morrow Keith D | $275,786 | |
| Previous Owner | Bank Colman H | $205,600 | |
| Previous Owner | Hild Lawrence C | $158,850 |
Source: Public Records
Tax History
| Year | Tax Paid | Tax Assessment Tax Assessment Total Assessment is a certain percentage of the fair market value that is determined by local assessors to be the total taxable value of land and additions on the property. | Land | Improvement |
|---|---|---|---|---|
| 2025 | $5,072 | $85,030 | $30,120 | $54,910 |
| 2024 | $5,072 | $78,150 | $27,340 | $50,810 |
| 2023 | $5,118 | $78,150 | $27,340 | $50,810 |
| 2022 | $4,661 | $65,190 | $23,430 | $41,760 |
| 2021 | $4,633 | $65,190 | $23,430 | $41,760 |
| 2020 | $5,116 | $68,860 | $19,270 | $49,590 |
| 2019 | $5,056 | $68,860 | $19,270 | $49,590 |
| 2018 | $3,929 | $49,440 | $17,350 | $32,090 |
| 2017 | $3,885 | $49,440 | $17,350 | $32,090 |
| 2016 | $3,751 | $45,260 | $12,620 | $32,640 |
Source: Public Records
Map
Nearby Homes
- 724 Clayton Corners Dr
- 718 Savannah Crossing Way
- 502 Iron Lantern Dr
- 500 Kingridge Dr
- 426 Brooktree Dr
- 505 Glenmeadow Dr
- 909 Dutch Mill Dr
- 828 Windmill Dr
- 569 Highland Ridge Dr
- 490 Maymont Dr
- 102 Five Meadows Ln
- 103 Calico Ln
- 14443 Bantry Ln Unit 1
- 14443 Bantry Ln Unit 24
- 1022 Julianna Dr
- 449 Wildwood Pkwy
- 2052 Tramore Ct Unit 34D
- 1948 Dovershire Ct
- 1042 Parkwatch Dr
- 718 Chancellor Heights Dr
Your Personal Tour Guide
Ask me questions while you tour the home.