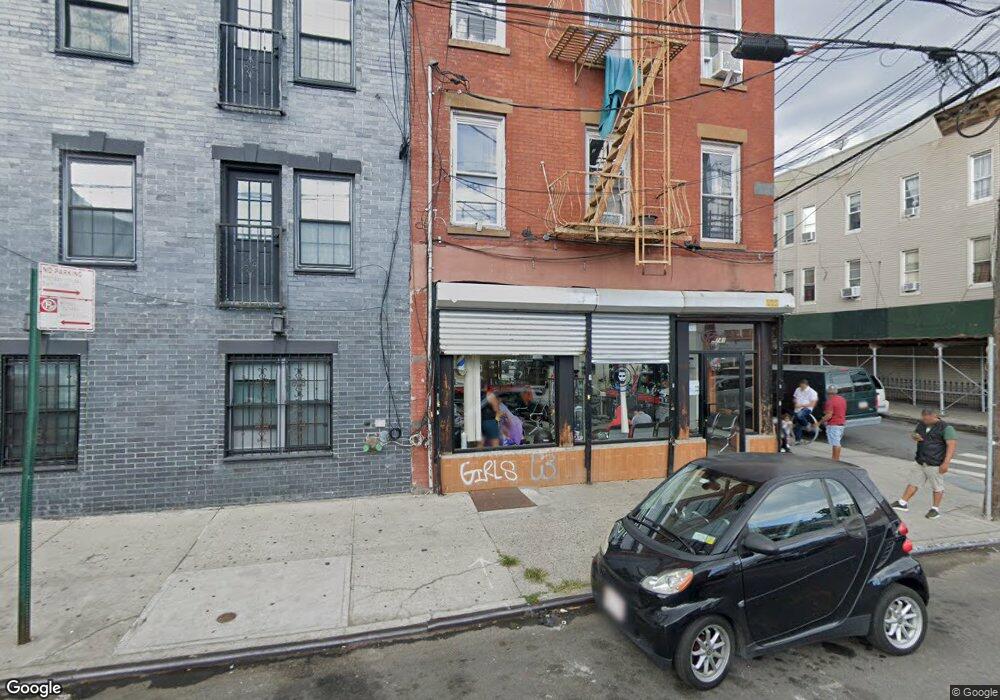
739 Liberty Ave Brooklyn, NY 11208
East New York NeighborhoodEstimated Value: $1,115,062
--
Bed
--
Bath
4,278
Sq Ft
$261/Sq Ft
Est. Value
About This Home
This home is located at 739 Liberty Ave, Brooklyn, NY 11208 and is currently estimated at $1,115,062, approximately $260 per square foot. 739 Liberty Ave is a home located in Kings County with nearby schools including P.S. 345 Patrolman Robert Bolden, Liberty Avenue Middle School, and Vista Academy.
Ownership History
Date
Name
Owned For
Owner Type
Purchase Details
Closed on
Dec 5, 2008
Sold by
Garcia Sabino
Bought by
Venegas Marnold
Current Estimated Value
Home Financials for this Owner
Home Financials are based on the most recent Mortgage that was taken out on this home.
Original Mortgage
$378,000
Outstanding Balance
$249,423
Interest Rate
6.27%
Mortgage Type
Commercial
Estimated Equity
$865,639
Purchase Details
Closed on
Jun 27, 2005
Sold by
Garcia Sabino and Torres Nurys
Bought by
Garcia Sabino
Purchase Details
Closed on
Nov 1, 1999
Sold by
Darnley Veneeta
Bought by
Garcia Sabino and Torres Nurys
Home Financials for this Owner
Home Financials are based on the most recent Mortgage that was taken out on this home.
Original Mortgage
$198,900
Interest Rate
7.84%
Mortgage Type
FHA
Purchase Details
Closed on
Sep 24, 1999
Sold by
Darnley Veneeta
Bought by
Curby Darnley Inc
Home Financials for this Owner
Home Financials are based on the most recent Mortgage that was taken out on this home.
Original Mortgage
$198,900
Interest Rate
7.84%
Mortgage Type
FHA
Purchase Details
Closed on
Jun 24, 1996
Sold by
Darnley Lurby
Bought by
Darnley Veneeta
Home Financials for this Owner
Home Financials are based on the most recent Mortgage that was taken out on this home.
Original Mortgage
$130,000
Interest Rate
8.08%
Mortgage Type
Commercial
Purchase Details
Closed on
May 4, 1995
Sold by
Fisher Foods Of Queens Inc
Bought by
Darnley Curby
Home Financials for this Owner
Home Financials are based on the most recent Mortgage that was taken out on this home.
Original Mortgage
$89,000
Interest Rate
8.2%
Mortgage Type
Commercial
Create a Home Valuation Report for This Property
The Home Valuation Report is an in-depth analysis detailing your home's value as well as a comparison with similar homes in the area
Home Values in the Area
Average Home Value in this Area
Purchase History
| Date | Buyer | Sale Price | Title Company |
|---|---|---|---|
| Venegas Marnold | $600,000 | -- | |
| Venegas Marnold | $600,000 | -- | |
| Garcia Sabino | -- | -- | |
| Garcia Sabino | -- | -- | |
| Garcia Sabino | $185,000 | Chicago Title Insurance Co | |
| Garcia Sabino | $185,000 | Chicago Title Insurance Co | |
| Curby Darnley Inc | -- | -- | |
| Curby Darnley Inc | -- | -- | |
| Darnley Veneeta | -- | Chicago Title Insurance Co | |
| Darnley Veneeta | -- | Chicago Title Insurance Co | |
| Darnley Curby | $105,000 | Commonwealth Land Title Ins | |
| Darnley Curby | $105,000 | Commonwealth Land Title Ins |
Source: Public Records
Mortgage History
| Date | Status | Borrower | Loan Amount |
|---|---|---|---|
| Open | Venegas Marnold | $378,000 | |
| Closed | Venegas Marnold | $378,000 | |
| Previous Owner | Garcia Sabino | $198,900 | |
| Previous Owner | Darnley Veneeta | $130,000 | |
| Previous Owner | Darnley Curby | $89,000 | |
| Closed | Garcia Sabino | $0 |
Source: Public Records
Tax History Compared to Growth
Tax History
| Year | Tax Paid | Tax Assessment Tax Assessment Total Assessment is a certain percentage of the fair market value that is determined by local assessors to be the total taxable value of land and additions on the property. | Land | Improvement |
|---|---|---|---|---|
| 2025 | $14,262 | $252,000 | $36,450 | $215,550 |
| 2024 | $14,262 | $210,150 | $36,450 | $173,700 |
| 2023 | $13,602 | $207,000 | $36,450 | $170,550 |
| 2022 | $9,421 | $172,350 | $36,450 | $135,900 |
| 2021 | $12,556 | $175,050 | $36,450 | $138,600 |
| 2020 | $5,715 | $171,900 | $36,450 | $135,450 |
| 2019 | $11,067 | $143,100 | $36,450 | $106,650 |
| 2018 | $10,848 | $85,293 | $26,071 | $59,222 |
| 2017 | $10,045 | $78,975 | $27,813 | $51,162 |
| 2016 | $10,150 | $78,732 | $30,513 | $48,219 |
| 2015 | $6,120 | $72,900 | $32,805 | $40,095 |
| 2014 | $6,120 | $67,500 | $36,450 | $31,050 |
Source: Public Records
Map
Nearby Homes
- 399 Linwood St
- 400 Linwood St
- 341 Essex St
- 283 Shepherd Ave
- 758 Glenmore Ave
- 253 Ashford St
- 349 Elton St
- 206 Elton St
- 295 Ashford St
- 203 Essex St
- 278 Ashford St
- 196 Shepherd Ave
- 851 Glenmore Ave
- 170 Atkins Ave
- 852 Glenmore Ave
- 37 Montauk Ave
- 389 Warwick St
- 90 Milford St
- 225 Hale Ave Unit HSE
- 633 Glenmore Ave
- 737 Liberty Ave
- 737 Liberty Ave Unit 2
- 735 Liberty Ave
- 743 Liberty Ave Unit 5
- 743 Liberty Ave
- 298 Essex St
- 731 Liberty Ave Unit 1
- 731 Liberty Ave
- 294 Essex St
- 729 Liberty Ave
- 745 Liberty Ave
- 292 Essex St
- 727 Liberty Ave
- 291 Essex St
- 288 Essex St
- 749 Liberty Ave
- 361 Linwood St
- 725 Liberty Ave
- 742 Liberty Ave
- 728 Liberty Ave