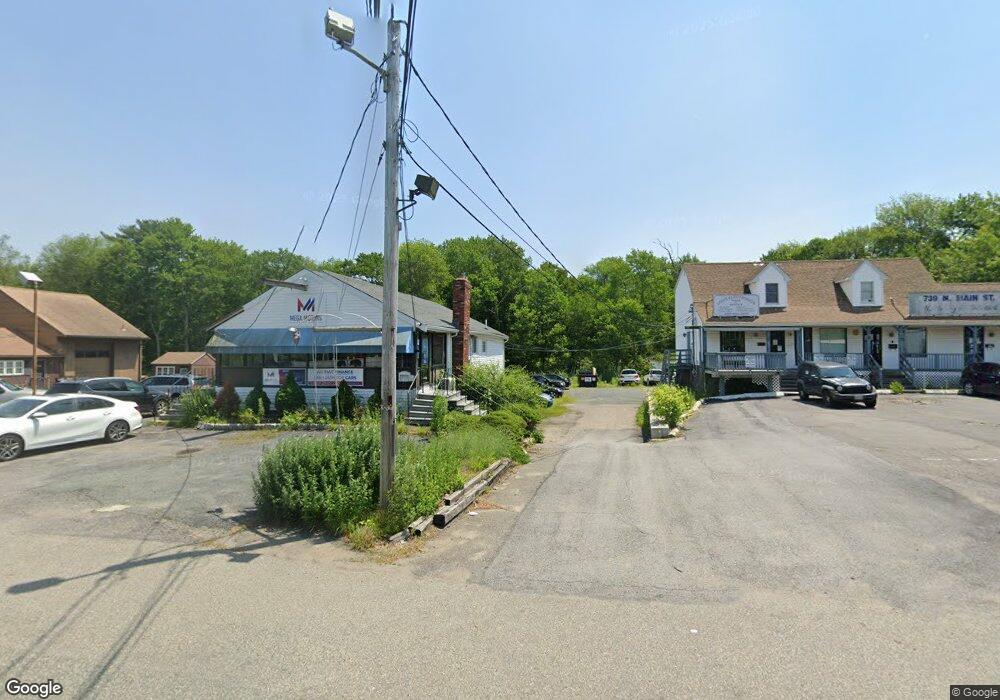
739 N Main St West Bridgewater, MA 02379
Estimated Value: $653,319
2
Beds
1
Bath
728
Sq Ft
$897/Sq Ft
Est. Value
About This Home
This home is located at 739 N Main St, West Bridgewater, MA 02379 and is currently estimated at $653,319, approximately $897 per square foot. 739 N Main St is a home located in Plymouth County with nearby schools including Spring Street Elementary School, Howard Elementary School, and Rose L. MacDonald Elementary School.
Ownership History
Date
Name
Owned For
Owner Type
Purchase Details
Closed on
Jul 9, 2020
Sold by
Liberty Enterprises Rt
Bought by
Gta Enterprises Llc
Current Estimated Value
Purchase Details
Closed on
Aug 16, 1983
Bought by
Liberty Enterprises Rt
Create a Home Valuation Report for This Property
The Home Valuation Report is an in-depth analysis detailing your home's value as well as a comparison with similar homes in the area
Home Values in the Area
Average Home Value in this Area
Purchase History
| Date | Buyer | Sale Price | Title Company |
|---|---|---|---|
| Gta Enterprises Llc | $425,000 | None Available | |
| Liberty Enterprises Rt | -- | -- |
Source: Public Records
Mortgage History
| Date | Status | Borrower | Loan Amount |
|---|---|---|---|
| Previous Owner | Liberty Enterprises Rt | $30,000 |
Source: Public Records
Tax History Compared to Growth
Tax History
| Year | Tax Paid | Tax Assessment Tax Assessment Total Assessment is a certain percentage of the fair market value that is determined by local assessors to be the total taxable value of land and additions on the property. | Land | Improvement |
|---|---|---|---|---|
| 2025 | $13,649 | $552,600 | $288,700 | $263,900 |
| 2024 | $13,649 | $536,700 | $278,000 | $258,700 |
| 2023 | $0 | $495,400 | $246,000 | $249,400 |
| 2022 | $13,649 | $479,600 | $235,300 | $244,300 |
| 2021 | $0 | $479,600 | $235,300 | $244,300 |
| 2020 | $13,649 | $479,600 | $235,300 | $244,300 |
| 2019 | $13,261 | $479,600 | $235,300 | $244,300 |
| 2018 | $13,578 | $475,100 | $235,300 | $239,800 |
| 2017 | $12,777 | $445,500 | $213,900 | $231,600 |
| 2016 | $12,666 | $434,800 | $203,200 | $231,600 |
| 2015 | $12,347 | $429,000 | $192,500 | $236,500 |
| 2014 | $11,399 | $429,000 | $192,500 | $236,500 |
Source: Public Records
Map
Nearby Homes
- 16 Friendship Dr
- 18 American Ave
- 1 Fairway Dr
- 42 Matfield St
- 21 Roosevelt Ave
- 13 Finny's Way
- 1845 Main St
- Lot 1 Jeffrey Ln
- 6 Maddison
- 15 Fieldstone Dr
- 358 Copeland St
- 386 Matfield St
- 139 Geralynn Dr
- 281 Spring St
- 35 Longworth Ave Unit 17
- 1 Thomas Cir
- 50 Belmont St
- 19 Progressive Ave
- 578 Plain St
- 768 East St