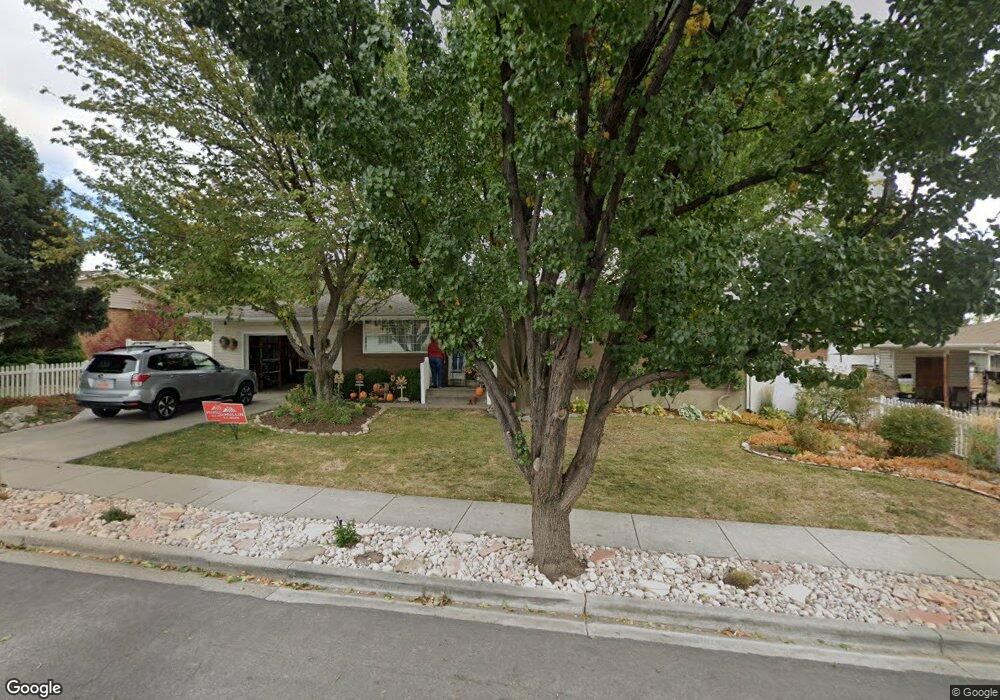
739 W 925 S Woods Cross, UT 84087
Estimated Value: $456,000 - $481,219
3
Beds
2
Baths
1,204
Sq Ft
$390/Sq Ft
Est. Value
About This Home
This home is located at 739 W 925 S, Woods Cross, UT 84087 and is currently estimated at $469,055, approximately $389 per square foot. 739 W 925 S is a home located in Davis County with nearby schools including Woods Cross Elementary School, Millcreek Junior High School, and Woods Cross High School.
Ownership History
Date
Name
Owned For
Owner Type
Purchase Details
Closed on
Sep 19, 2011
Sold by
Landward Loren E and Landward Carolyn
Bought by
Landward Loren E and Landward Carolyn
Current Estimated Value
Home Financials for this Owner
Home Financials are based on the most recent Mortgage that was taken out on this home.
Original Mortgage
$101,000
Interest Rate
3.43%
Mortgage Type
New Conventional
Purchase Details
Closed on
Oct 29, 2001
Sold by
Landward Loren E and Landward Carolyn
Bought by
Landward Loren E and Landward Carolyn
Home Financials for this Owner
Home Financials are based on the most recent Mortgage that was taken out on this home.
Original Mortgage
$130,800
Interest Rate
6.84%
Purchase Details
Closed on
May 16, 2000
Sold by
Landward Loren E and Landward Carolyn J
Bought by
Landward Loren E and Landward Carolyn J
Purchase Details
Closed on
Oct 23, 1996
Sold by
Landward Loren E
Bought by
Landward Loren E and Landward Carolyn J
Create a Home Valuation Report for This Property
The Home Valuation Report is an in-depth analysis detailing your home's value as well as a comparison with similar homes in the area
Home Values in the Area
Average Home Value in this Area
Purchase History
| Date | Buyer | Sale Price | Title Company |
|---|---|---|---|
| Landward Loren E | -- | Backman Title Servic | |
| Landward Loren E | -- | Backman Title Servic | |
| Landward Loren E | -- | Associated Title Company | |
| Landward Loren E | -- | Associated Title Company | |
| Landward Loren E | -- | -- | |
| Landward Loren E | -- | Backman Stewart Title Servic |
Source: Public Records
Mortgage History
| Date | Status | Borrower | Loan Amount |
|---|---|---|---|
| Closed | Landward Loren E | $101,000 | |
| Closed | Landward Loren E | $130,800 |
Source: Public Records
Tax History Compared to Growth
Tax History
| Year | Tax Paid | Tax Assessment Tax Assessment Total Assessment is a certain percentage of the fair market value that is determined by local assessors to be the total taxable value of land and additions on the property. | Land | Improvement |
|---|---|---|---|---|
| 2025 | $2,850 | $242,550 | $110,834 | $131,716 |
| 2024 | $2,764 | $242,000 | $117,996 | $124,004 |
| 2023 | $2,629 | $429,000 | $156,166 | $272,834 |
| 2022 | $2,558 | $231,550 | $67,880 | $163,670 |
| 2021 | $2,251 | $323,000 | $99,538 | $223,462 |
| 2020 | $2,032 | $288,000 | $94,720 | $193,280 |
| 2019 | $2,018 | $282,000 | $89,365 | $192,635 |
| 2018 | $1,850 | $256,000 | $87,881 | $168,119 |
| 2016 | $1,519 | $115,225 | $37,474 | $77,751 |
| 2015 | $1,435 | $105,435 | $37,474 | $67,961 |
| 2014 | $1,399 | $106,242 | $37,474 | $68,768 |
| 2013 | -- | $94,685 | $20,683 | $74,002 |
Source: Public Records
Map
Nearby Homes
- 758 W 1000 S
- 743 W 1000 S
- 1289 S 675 W
- 730 W 1400 S
- 553 Clark St
- 990 S 500 W
- 1552 S 850 W
- 1137 S 1050 W
- 1623 S 925 W
- 1056 W Audrey Ln Unit 14
- 1602 S 550 W
- 1288 S 1050 W
- 680 W 500 S Unit 22
- 680 W 500 S Unit 17
- 1064 W Audrey Ln Unit 15
- 1067 W Audrey Ln Unit 8
- 1069 W Linden Ln Unit 31
- 1072 W Audrey Ln Unit 17
- 770 W 1900 S
- 1075 W Audrey Ln Unit 6