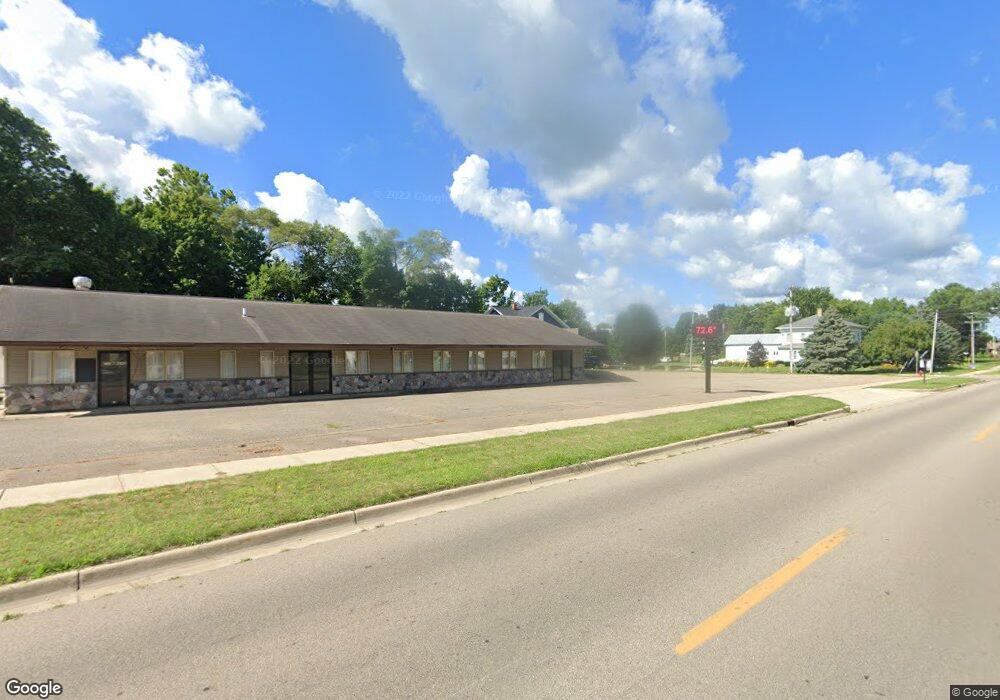
739 W Main St Mendon, MI 49072
Estimated Value: $96,714
About This Home
This home is located at 739 W Main St, Mendon, MI 49072 and is currently priced at $96,714, approximately $15 per square foot. 739 W Main St is a home located in St. Joseph County with nearby schools including Mendon Elementary School and Mendon Middle/High School.
Ownership History
We collect this data history from publicly available records. To have your information removed, we recommend requesting removal directly through your county’s website.
Purchase Details
Purchase Details
Purchase Details
Purchase Details
Purchase Details
Purchase History
We collect this data history from publicly available records. To have your information removed, we recommend requesting removal directly through your county’s website.
| Date | Buyer | Sale Price | Title Company |
|---|---|---|---|
| -- | Patrick Abstract & Ttl Offic | ||
| $64,000 | Patrick Abstract & Ttl Offic | ||
| $130,000 | -- | ||
| -- | -- | ||
| -- | -- |
Tax History
We collect this data history from publicly available records. To have your information removed, we recommend requesting removal directly through your county’s website.
| Year | Tax Paid | Tax Assessment Tax Assessment Total Assessment is a certain percentage of the fair market value that is determined by local assessors to be the total taxable value of land and additions on the property. | Land | Improvement |
|---|---|---|---|---|
| 2025 | $1,434 | $98,100 | $15,700 | $82,400 |
| 2024 | $1,434 | $92,000 | $17,400 | $74,600 |
| 2023 | $734 | $90,700 | $15,900 | $74,800 |
| 2022 | $0 | $85,000 | $14,800 | $70,200 |
| 2021 | $2,529 | $64,300 | $12,500 | $51,800 |
| 2020 | $557 | $69,300 | $12,500 | $56,800 |
| 2019 | $623 | $60,300 | $8,800 | $51,500 |
| 2018 | $3,347 | $62,600 | $10,800 | $51,800 |
| 2017 | $3,267 | $57,600 | $57,600 | $0 |
| 2016 | -- | $56,000 | $56,000 | $0 |
| 2015 | -- | $56,200 | $0 | $0 |
| 2014 | -- | $59,300 | $59,300 | $0 |
| 2012 | -- | $64,800 | $64,800 | $0 |
Map
- VL S Locust St
- 106 W State St
- 235 N Nottawa St
- 315 East St
- 55530 Bucknell Ln
- 30315 Jacksonburg Rd
- 22951 Riverside Dr
- 53532 Parkville Rd
- 55637 Bennett Rd
- 55686 Parkville Rd
- 30069 Brandt Rd
- 20282 Groveland Ave
- 53644 N Fisher Lake Rd
- 20070 Parkway Ave
- 20160 Parkway Ave
- 55572 N Fisher Lake Rd
- 55019 N Fisher Lake Rd
- 20008 M 60
- 19976 Michigan 60
- 30879 Michigan 60
- 739 W Main St Unit 100
- 803 W Main St
- 803 W Main St
- 115 S Locust St
- 806 W Main St
- 829 W Main St
- 738 W Main St
- 718 Buchanan St
- 730 W Main St
- 117 Plainfield Dr
- 121 Plainfield Dr
- 725 Maple
- 222 S Locust St
- 710 W Main St
- 715 Maple
- 705 Buchanan St
- 223 S Locust St
- 700 W Main St
- 120 Plainfield Dr
- 632 W Main St
Ask me questions while you tour the home.