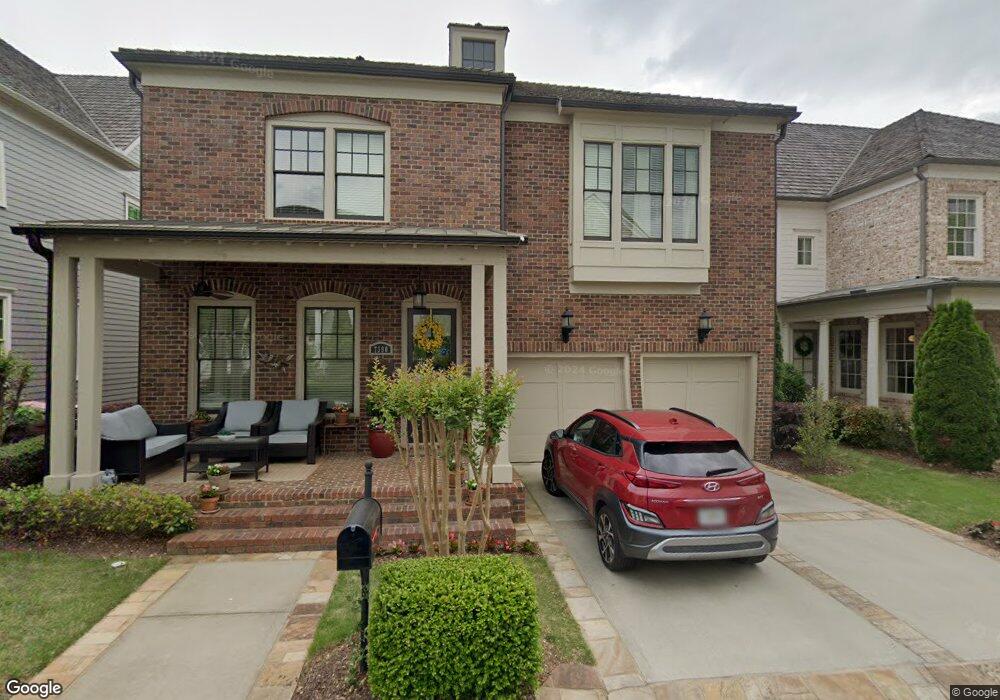
7390 Samples Field Rd Unit 338 Cumming, GA 30041
Estimated Value: $958,880 - $1,126,000
4
Beds
4
Baths
3,307
Sq Ft
$315/Sq Ft
Est. Value
About This Home
This home is located at 7390 Samples Field Rd Unit 338, Cumming, GA 30041 and is currently estimated at $1,042,970, approximately $315 per square foot. 7390 Samples Field Rd Unit 338 is a home located in Forsyth County with nearby schools including Vickery Creek Middle School, West Forsyth High School, and Montessori at Vickery.
Ownership History
Date
Name
Owned For
Owner Type
Purchase Details
Closed on
Nov 22, 2019
Sold by
Muriel Pedro Antonio
Bought by
Mahoney Gerald James and Mahoney Frida P
Current Estimated Value
Home Financials for this Owner
Home Financials are based on the most recent Mortgage that was taken out on this home.
Original Mortgage
$450,000
Outstanding Balance
$394,273
Interest Rate
3.75%
Mortgage Type
New Conventional
Estimated Equity
$648,697
Purchase Details
Closed on
Jul 8, 2016
Bought by
Lynn Muriel Pedro Antonio and Lynn Muriel Shana
Home Financials for this Owner
Home Financials are based on the most recent Mortgage that was taken out on this home.
Original Mortgage
$264,039
Interest Rate
3.6%
Mortgage Type
New Conventional
Purchase Details
Closed on
Jul 26, 2013
Sold by
Wells Fargo Bank Na
Bought by
Jw Homes Llc
Create a Home Valuation Report for This Property
The Home Valuation Report is an in-depth analysis detailing your home's value as well as a comparison with similar homes in the area
Home Values in the Area
Average Home Value in this Area
Purchase History
| Date | Buyer | Sale Price | Title Company |
|---|---|---|---|
| Mahoney Gerald James | $580,000 | -- | |
| Lynn Muriel Pedro Antonio | $564,039 | -- | |
| Jw Homes Llc | $2,485,000 | -- |
Source: Public Records
Mortgage History
| Date | Status | Borrower | Loan Amount |
|---|---|---|---|
| Open | Mahoney Gerald James | $450,000 | |
| Previous Owner | Lynn Muriel Pedro Antonio | $264,039 |
Source: Public Records
Tax History Compared to Growth
Tax History
| Year | Tax Paid | Tax Assessment Tax Assessment Total Assessment is a certain percentage of the fair market value that is determined by local assessors to be the total taxable value of land and additions on the property. | Land | Improvement |
|---|---|---|---|---|
| 2025 | $1,885 | $373,940 | $128,000 | $245,940 |
| 2024 | $1,885 | $390,876 | $110,000 | $280,876 |
| 2023 | $1,825 | $402,648 | $72,000 | $330,648 |
| 2022 | $1,874 | $245,676 | $66,000 | $179,676 |
| 2021 | $1,804 | $245,676 | $66,000 | $179,676 |
| 2020 | $1,776 | $232,000 | $65,360 | $166,640 |
| 2019 | $6,245 | $234,164 | $66,000 | $168,164 |
| 2018 | $6,067 | $225,204 | $48,000 | $177,204 |
| 2017 | $5,854 | $214,080 | $48,000 | $166,080 |
| 2016 | $1,110 | $40,000 | $40,000 | $0 |
| 2015 | $545 | $19,600 | $19,600 | $0 |
| 2014 | $519 | $19,600 | $0 | $0 |
Source: Public Records
Map
Nearby Homes
- 7345 Samples Field Rd
- 5850 Bentley Rd
- 5878 Bentley Rd
- 7235 Cordery Rd
- 6035 Sarah Orr Ln
- 5364 Post Rd
- 7275 Cordery Rd
- 7285 Cordery Rd
- 7315 Cordery Rd
- 5840 Palmtree Pass
- 6445 Wesley Hughes Rd
- 5450 Chestnut Dr
- 5545 Vickery Cir
- 6820 Colfax Ave
- 6150 Ivey Springs Chase
- 5310 Cole Creek Ln
- 5265 Cole Creek Ln
- 5390 Vickery Cir
- 5525 Nesmith Ct
- 5605 Copper Creek Pass
- 7390 Samples Field Rd
- 7410 Samples Field Rd
- 7410 Samples Field Rd Unit 339
- 7380 Samples Field Rd Unit 337
- 7380 Samples Field Rd
- 7420 Samples Field Rd
- 7430 Samples Field Rd Unit 341
- 7430 Samples Field Rd
- 7370 Samples Field Rd Unit 336
- 7370 Samples Field Rd
- 7385 Samples Field Rd
- 7395 Samples Field Rd
- 7375 Samples Field Rd Unit 362
- 7375 Samples Field Rd
- 7405 Samples Field Rd
- 7415 Samples Field Rd
- 7425 Samples Field Rd Unit 367
- 7425 Samples Field Rd
- 7365 Samples Field Rd
- 7435 Samples Field Rd