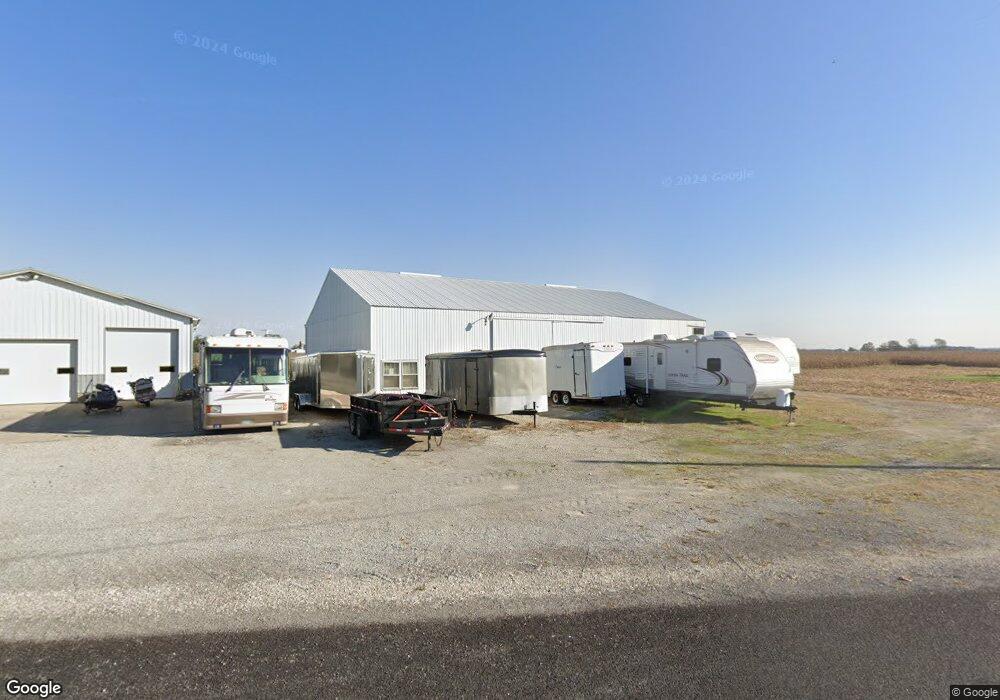
7391 Sebastian Rd Celina, OH 45822
Estimated Value: $372,000 - $425,000
5
Beds
4
Baths
3,870
Sq Ft
$101/Sq Ft
Est. Value
About This Home
This home is located at 7391 Sebastian Rd, Celina, OH 45822 and is currently estimated at $392,765, approximately $101 per square foot. 7391 Sebastian Rd is a home located in Mercer County with nearby schools including Marion Local Elementary School and Marion Local High School.
Ownership History
Date
Name
Owned For
Owner Type
Purchase Details
Closed on
Oct 21, 2019
Sold by
Tuente Ronald W and Tuente Marleen L
Bought by
Leugers Norman Joseph and Leugers Angela Lynn
Current Estimated Value
Home Financials for this Owner
Home Financials are based on the most recent Mortgage that was taken out on this home.
Original Mortgage
$42,000
Outstanding Balance
$35,053
Interest Rate
3.5%
Mortgage Type
Future Advance Clause Open End Mortgage
Estimated Equity
$357,712
Purchase Details
Closed on
Oct 6, 2009
Sold by
Tuente Roger B and Tuente Mary Ellen
Bought by
Leugers Norman Joseph and Leugers Angela Lynn
Home Financials for this Owner
Home Financials are based on the most recent Mortgage that was taken out on this home.
Original Mortgage
$42,000
Interest Rate
5.1%
Mortgage Type
Future Advance Clause Open End Mortgage
Purchase Details
Closed on
Nov 12, 1992
Bought by
Leugers Norman and Leugers Angela
Create a Home Valuation Report for This Property
The Home Valuation Report is an in-depth analysis detailing your home's value as well as a comparison with similar homes in the area
Home Values in the Area
Average Home Value in this Area
Purchase History
| Date | Buyer | Sale Price | Title Company |
|---|---|---|---|
| Leugers Norman Joseph | -- | None Available | |
| Leugers Norman Joseph | -- | Attorney | |
| Leugers Norman | $72,000 | -- |
Source: Public Records
Mortgage History
| Date | Status | Borrower | Loan Amount |
|---|---|---|---|
| Open | Leugers Norman Joseph | $42,000 | |
| Previous Owner | Leugers Norman Joseph | $42,000 |
Source: Public Records
Tax History Compared to Growth
Tax History
| Year | Tax Paid | Tax Assessment Tax Assessment Total Assessment is a certain percentage of the fair market value that is determined by local assessors to be the total taxable value of land and additions on the property. | Land | Improvement |
|---|---|---|---|---|
| 2024 | $3,842 | $99,340 | $11,170 | $88,170 |
| 2023 | $3,842 | $99,340 | $11,170 | $88,170 |
| 2022 | $2,630 | $64,160 | $6,510 | $57,650 |
| 2021 | $2,672 | $64,160 | $6,510 | $57,650 |
| 2020 | $2,668 | $64,160 | $6,510 | $57,650 |
| 2019 | $2,628 | $61,190 | $6,060 | $55,130 |
| 2018 | $2,701 | $61,190 | $6,060 | $55,130 |
| 2017 | $282 | $61,190 | $6,060 | $55,130 |
| 2016 | $2,586 | $59,190 | $6,860 | $52,330 |
| 2015 | $2,529 | $59,190 | $6,860 | $52,330 |
| 2014 | $2,532 | $59,190 | $6,860 | $52,330 |
| 2013 | $2,300 | $47,740 | $5,530 | $42,210 |
Source: Public Records
Map
Nearby Homes
- 2102 Thobe Ln
- 2109 Thobe Ln
- 2101 Thobe Ln
- 2093 Thobe Ln
- 2079 Thobe Ln
- 2065 Thobe Ln
- 77 N Canal St
- 5272 Prairie View Dr
- 6942 Heron Dr
- 6953 Ohio 219 Unit Lot 7
- 6953 State Route 219 Unit 4
- 5240 Grove Dr
- 5464 Ada Dr
- 5383 U S 127
- 0 Ohio 118
- 426 E Walnut St
- 402 E Elizabeth St
- 721 Lilac Dr
- 0 Coletta Ct Unit 24/1807 1032998
- 0 Coletta Ct Unit 23/1806 1032997
- 7384 Sebastian Rd
- 3273 County Road 716a
- 3241 County Road 716a
- 7364 Sebastian Rd
- 7351 Sebastian Rd
- 3210 County Road 716a
- 7429 Sebastian Rd
- 3295 County Road 716a
- 7426 Sebastian Rd
- 3304 County Road 716a
- 7325 Sebastian Rd
- 3200 County Road 716a
- 7350 Sebastian Rd
- 3318 County Road 716a
- 3188 County Road 716a
- 7311 Sebastian Rd
- 3330 County Road 716a
- 7434 Sebastian Rd
- 3178 County Road 716a
- 3160 County Road 716a