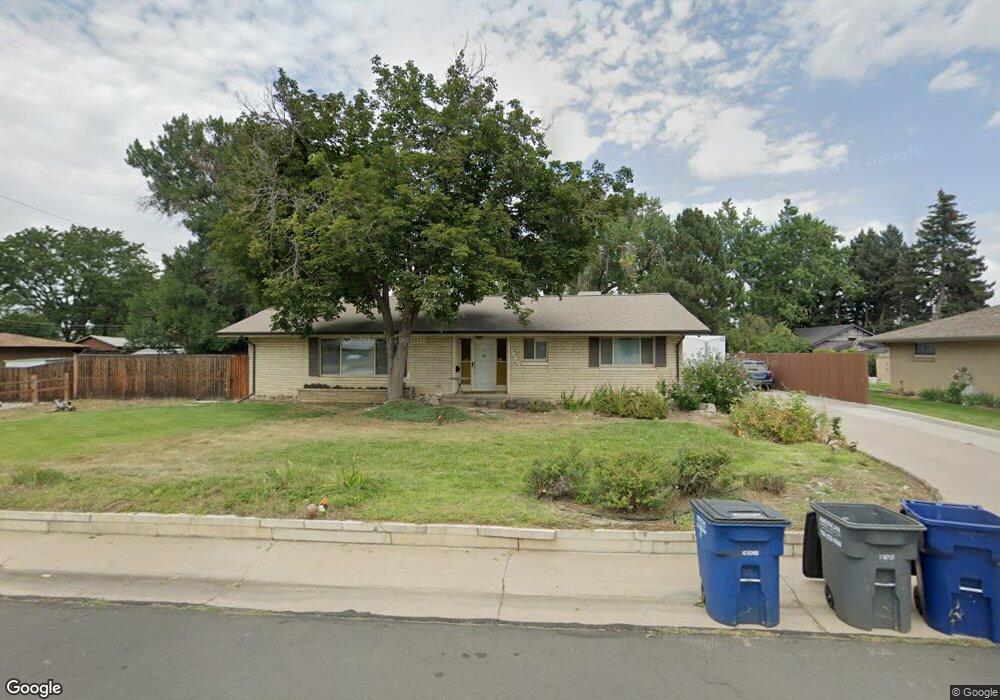
7391 W 48th Cir Wheat Ridge, CO 80033
Barths NeighborhoodEstimated Value: $691,000 - $859,000
2
Beds
3
Baths
2,278
Sq Ft
$343/Sq Ft
Est. Value
About This Home
This home is located at 7391 W 48th Cir, Wheat Ridge, CO 80033 and is currently estimated at $782,315, approximately $343 per square foot. 7391 W 48th Cir is a home located in Jefferson County with nearby schools including Stevens Elementary School, Everitt Middle School, and Wheat Ridge High School.
Ownership History
Date
Name
Owned For
Owner Type
Purchase Details
Closed on
Nov 22, 2013
Sold by
Aregood Nelson E
Bought by
Fothergill Zachary and Parker Margarite
Current Estimated Value
Home Financials for this Owner
Home Financials are based on the most recent Mortgage that was taken out on this home.
Original Mortgage
$416,100
Outstanding Balance
$309,566
Interest Rate
4.17%
Mortgage Type
New Conventional
Estimated Equity
$472,749
Purchase Details
Closed on
Nov 15, 2004
Sold by
Aregood Nelson E and Aregood Ellen L
Bought by
Aregood Nelson E
Home Financials for this Owner
Home Financials are based on the most recent Mortgage that was taken out on this home.
Original Mortgage
$392,413
Interest Rate
3.97%
Mortgage Type
FHA
Create a Home Valuation Report for This Property
The Home Valuation Report is an in-depth analysis detailing your home's value as well as a comparison with similar homes in the area
Home Values in the Area
Average Home Value in this Area
Purchase History
| Date | Buyer | Sale Price | Title Company |
|---|---|---|---|
| Fothergill Zachary | $438,000 | Guardian Title | |
| Aregood Nelson E | -- | Atgf |
Source: Public Records
Mortgage History
| Date | Status | Borrower | Loan Amount |
|---|---|---|---|
| Open | Fothergill Zachary | $416,100 | |
| Previous Owner | Aregood Nelson E | $392,413 | |
| Closed | Aregood Nelson E | $392,413 |
Source: Public Records
Tax History Compared to Growth
Tax History
| Year | Tax Paid | Tax Assessment Tax Assessment Total Assessment is a certain percentage of the fair market value that is determined by local assessors to be the total taxable value of land and additions on the property. | Land | Improvement |
|---|---|---|---|---|
| 2024 | $4,230 | $48,384 | $19,535 | $28,849 |
| 2023 | $4,230 | $48,384 | $19,535 | $28,849 |
| 2022 | $3,519 | $39,531 | $18,845 | $20,686 |
| 2021 | $3,568 | $40,669 | $19,388 | $21,281 |
| 2020 | $3,167 | $36,272 | $16,402 | $19,870 |
| 2019 | $3,124 | $36,272 | $16,402 | $19,870 |
| 2018 | $2,937 | $32,955 | $12,119 | $20,836 |
| 2017 | $2,652 | $32,955 | $12,119 | $20,836 |
| 2016 | $2,720 | $31,628 | $8,234 | $23,394 |
| 2015 | $2,162 | $31,628 | $8,234 | $23,394 |
| 2014 | $2,162 | $23,583 | $6,190 | $17,393 |
Source: Public Records
Map
Nearby Homes
- 7505 W 47th Ave
- 4711 Wadsworth Blvd
- 7221 W 48th Ave
- 6920 W 47th Place
- 6920 W 48th Ave Unit 6920
- 4541 Reed St
- 4420 Teller St
- 4730 Pierce St
- 4730 Otis St
- 7010 W 44th Ave
- 7808 W 43rd Place
- 8083 W 51st Place Unit 204
- 4787 Carr St
- 4785 Carr St
- 6801 W 52nd Ave
- 8360 W 50th Ave
- 8530 W 46th Ave
- 4105 Yarrow Ct
- 4125 Pierce St
- 4752 Dover St
- 7395 W 48th Cir
- 7465 W 48th Cir
- 7400 W 48th Ave
- 7390 W 48th Ave
- 7350 W 48th Ave
- 7400 W 48th Cir
- 4755 Upham St
- 7495 W 48th Cir
- 4775 Upham St
- 7490 W 48th Ave
- 7450 W 48th Cir
- 7390 W 48th Cir
- 4715 Upham St
- 4795 Upham St
- 7470 W 48th Cir
- 4705 Upham St
- 7490 W 48th Cir
- 7395 W 47th Ave
- 7403 W 48th Ave
- 7385 W 47th Ave