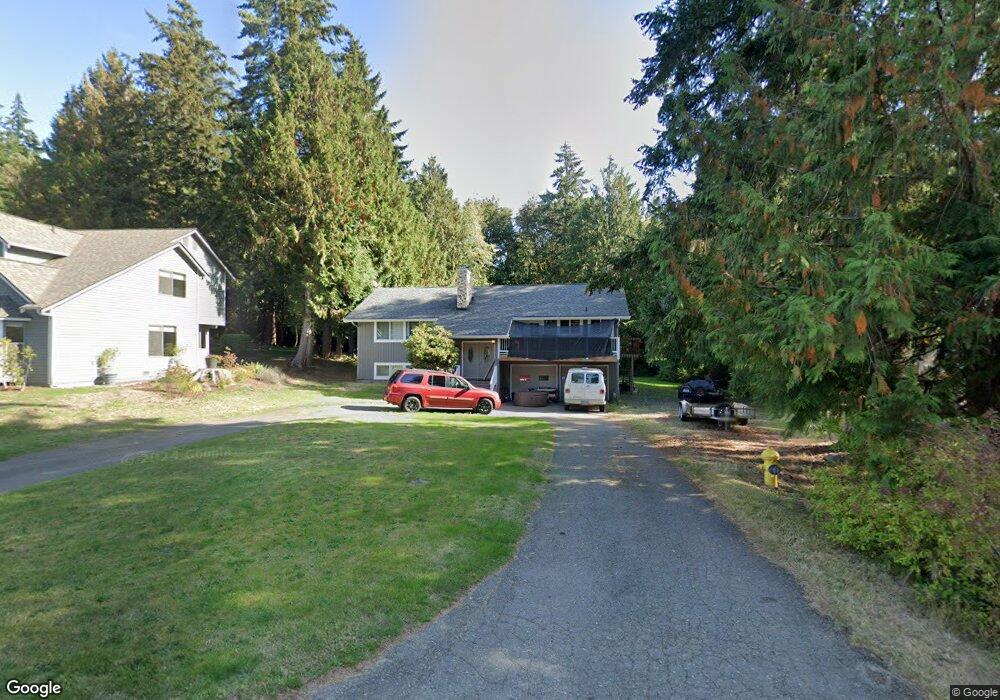
7392 Lazy s Ln NE Bremerton, WA 98311
Estimated Value: $546,000 - $617,000
4
Beds
3
Baths
1,506
Sq Ft
$378/Sq Ft
Est. Value
About This Home
This home is located at 7392 Lazy s Ln NE, Bremerton, WA 98311 and is currently estimated at $569,930, approximately $378 per square foot. 7392 Lazy s Ln NE is a home located in Kitsap County with nearby schools including Esquire Hills Elementary School, Fairview Middle School, and Olympic High School.
Ownership History
Date
Name
Owned For
Owner Type
Purchase Details
Closed on
Dec 15, 2020
Sold by
Tutterrow Randy A
Bought by
Tutterow Randy A and Tutterrow Hillary Ann
Current Estimated Value
Home Financials for this Owner
Home Financials are based on the most recent Mortgage that was taken out on this home.
Original Mortgage
$225,000
Outstanding Balance
$199,073
Interest Rate
2.7%
Mortgage Type
New Conventional
Estimated Equity
$370,857
Purchase Details
Closed on
Jul 18, 2001
Sold by
Bates Kenneth M
Bought by
Tutterrow Randy A
Home Financials for this Owner
Home Financials are based on the most recent Mortgage that was taken out on this home.
Original Mortgage
$139,806
Interest Rate
7.21%
Mortgage Type
FHA
Purchase Details
Closed on
Jun 26, 1997
Sold by
Bates Kenneth M
Bought by
The Kenneth M Bates Revocable Living Tr and Bates Kenneth M
Create a Home Valuation Report for This Property
The Home Valuation Report is an in-depth analysis detailing your home's value as well as a comparison with similar homes in the area
Home Values in the Area
Average Home Value in this Area
Purchase History
| Date | Buyer | Sale Price | Title Company |
|---|---|---|---|
| Tutterow Randy A | -- | Land Ttl Co Silverdale Submi | |
| Tutterrow Randy A | $142,000 | Pacific Nw Title | |
| The Kenneth M Bates Revocable Living Tr | -- | -- |
Source: Public Records
Mortgage History
| Date | Status | Borrower | Loan Amount |
|---|---|---|---|
| Open | Tutterow Randy A | $225,000 | |
| Closed | Tutterrow Randy A | $139,806 |
Source: Public Records
Tax History Compared to Growth
Tax History
| Year | Tax Paid | Tax Assessment Tax Assessment Total Assessment is a certain percentage of the fair market value that is determined by local assessors to be the total taxable value of land and additions on the property. | Land | Improvement |
|---|---|---|---|---|
| 2026 | $4,682 | $496,410 | $116,930 | $379,480 |
| 2025 | $4,682 | $496,410 | $116,930 | $379,480 |
| 2024 | $4,555 | $496,410 | $116,930 | $379,480 |
| 2023 | $4,571 | $496,410 | $116,930 | $379,480 |
| 2022 | $4,304 | $411,530 | $96,640 | $314,890 |
| 2021 | $4,242 | $386,060 | $71,640 | $314,420 |
| 2020 | $3,969 | $365,370 | $67,600 | $297,770 |
| 2019 | $3,698 | $329,230 | $61,050 | $268,180 |
| 2018 | $3,965 | $272,390 | $50,450 | $221,940 |
| 2017 | $3,505 | $272,390 | $50,450 | $221,940 |
| 2016 | $3,408 | $244,790 | $45,040 | $199,750 |
| 2015 | $3,111 | $232,880 | $49,890 | $182,990 |
| 2014 | -- | $221,550 | $49,890 | $171,660 |
| 2013 | -- | $221,550 | $49,890 | $171,660 |
Source: Public Records
Map
Nearby Homes
- 7265 Thasos Ave NE
- 7726 Lazy s Ln NE
- 7020 Saint Charles Ln NE
- 7655 Forest Ridge Dr NE
- 0 Kaster Dr NE
- 3924 McCormick Village Dr Unit 25
- 2940 Osiris Ct NE
- 2112 NE Lexington Dr
- 3000 NE Loyola St
- 8065 Autumn Hills Place NE
- 2348 NE Windsor Ct
- 3060 NE Mcwilliams Rd Unit 104
- 3060 NE Mcwilliams Rd Unit 124
- 3060 NE Mcwilliams Rd Unit 9
- 6522 State Hwy 303 NE
- 9422 Fairhaven Cir NE
- 1858 NE Mcwilliams Rd
- 8259 Kaster Dr NE
- 7761 Beacon Place NE Unit 103
- 7701 Beacon Place NE Unit B103
- 7374 Lazy s Ln NE
- 7422 Lazy s Ln NE
- 7354 Lazy s Ln NE
- 7375 Lazy s Ln NE
- 2295 NE Goldenrod Cir
- 2299 NE Goldenrod Cir
- 7423 Haynes Ln NE
- 7348 Lazy s Ln NE
- 7417 Lazy s Ln NE
- 7440 Lazy s Ln NE
- 7393 Haynes Ln NE
- 7325 Lazy s Ln NE
- 7330 Lazy s Ln NE
- 7437 Haynes Ln NE
- 7429 Lazy s Ln NE
- 7293 Pheasant Cir NE
- 7379 Haynes Ln NE
- 2362 NE Meadowlark Cir
- 7318 Lazy s Ln NE