
7393 Little Jimmy Grove Fountain, CO 80817
Central Fountain Valley NeighborhoodEstimated payment $1,971/month
Highlights
- Property is near a park
- End Unit
- Landscaped
- Vaulted Ceiling
- Covered Patio or Porch
- Luxury Vinyl Tile Flooring
About This Home
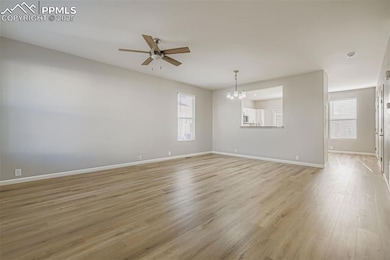
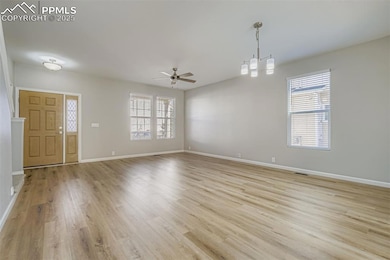
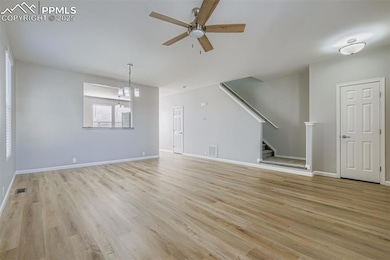
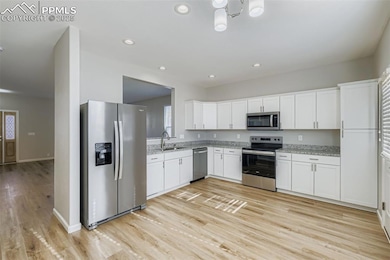
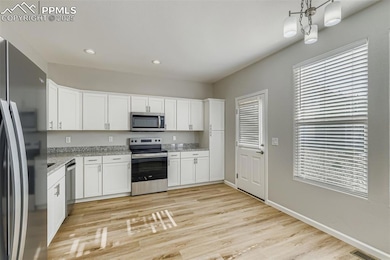
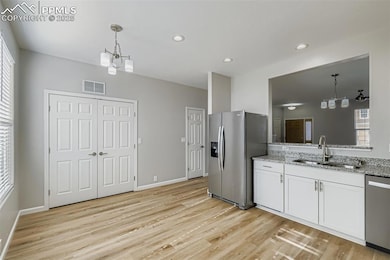
This spacious 3-bed, 2.5-bath end unit townhome in Countyside is perfect for someone looking for an updated move-in ready home! The townhome features new luxury vinyl plank flooring throughout the main level and all bathroom floors. The kitchen has new white shaker cabinets and granite countertops, with new stainless steel refrigerator, range and microwave oven. Upstairs you will find new carpet throughout with transition to luxury vinyl plank in the bathrooms which now boast white shaker cabinets, nickel faucets and granite countertops. The townhome has central air, but all bedrooms and the living room have ceiling fans. Countryside is an easy to commute to Fort Carson and has easy routes to both Peterson and Schriever Space Force Bases. The community also lies within easy walking distance to Fountain/Ft Carson High School, Conrad Early Learning Center and Metcalfe Park which features playground equipment and a skate park. The townhome has two reserved parking spaces and the crawlspace accessed through the coat closet provides plenty of extra storage space. Don't miss the opportunity to make this spacious and updated townhome yours!
Listing Agent
Broadmoor Bluffs Realty Brokerage Phone: 719-579-9211 Listed on: 11/21/2025
Townhouse Details
Home Type
- Townhome
Est. Annual Taxes
- $988
Year Built
- Built in 2007
Lot Details
- 1,255 Sq Ft Lot
- End Unit
- Landscaped
HOA Fees
- $309 Monthly HOA Fees
Parking
- Assigned Parking
Home Design
- Brick Exterior Construction
- Shingle Roof
- Aluminum Siding
Interior Spaces
- 1,507 Sq Ft Home
- 2-Story Property
- Vaulted Ceiling
- Ceiling Fan
- Six Panel Doors
- Crawl Space
- Electric Dryer Hookup
Kitchen
- Oven
- Microwave
- Dishwasher
- Disposal
Flooring
- Carpet
- Luxury Vinyl Tile
Bedrooms and Bathrooms
- 3 Bedrooms
Outdoor Features
- Covered Patio or Porch
Location
- Property is near a park
- Property is near schools
Schools
- Fountain Middle School
- Fountain/Ft Carson High School
Utilities
- Forced Air Heating and Cooling System
- Heating System Uses Natural Gas
- 220 Volts in Kitchen
Community Details
- Association fees include common utilities, covenant enforcement, insurance, ground maintenance, maintenance structure, management, snow removal, trash removal
Map
Home Values in the Area
Average Home Value in this Area
Tax History
| Year | Tax Paid | Tax Assessment Tax Assessment Total Assessment is a certain percentage of the fair market value that is determined by local assessors to be the total taxable value of land and additions on the property. | Land | Improvement |
|---|---|---|---|---|
| 2025 | $988 | $20,370 | -- | -- |
| 2024 | $849 | $20,240 | $4,020 | $16,220 |
| 2022 | $839 | $14,380 | $2,360 | $12,020 |
| 2021 | $780 | $14,800 | $2,430 | $12,370 |
| 2020 | $647 | $12,030 | $1,720 | $10,310 |
| 2019 | $635 | $12,030 | $1,720 | $10,310 |
| 2018 | $532 | $9,740 | $1,300 | $8,440 |
| 2017 | $526 | $9,740 | $1,300 | $8,440 |
| 2016 | $484 | $8,960 | $1,190 | $7,770 |
| 2015 | $485 | $8,960 | $1,190 | $7,770 |
| 2014 | $544 | $10,100 | $1,270 | $8,830 |
Property History
| Date | Event | Price | List to Sale | Price per Sq Ft |
|---|---|---|---|---|
| 11/27/2025 11/27/25 | Pending | -- | -- | -- |
| 11/21/2025 11/21/25 | For Sale | $300,000 | -- | $199 / Sq Ft |
Purchase History
| Date | Type | Sale Price | Title Company |
|---|---|---|---|
| Special Warranty Deed | $84,000 | Ats | |
| Trustee Deed | -- | None Available | |
| Special Warranty Deed | $149,387 | Land Title Guarantee Company |
Mortgage History
| Date | Status | Loan Amount | Loan Type |
|---|---|---|---|
| Open | $58,800 | Adjustable Rate Mortgage/ARM | |
| Previous Owner | $147,078 | FHA |
Source: Pikes Peak REALTOR® Services
MLS Number: 6255858
APN: 56081-07-011
Disclaimer: Certain information contained herein is derived from information provided by parties other than Homes.com. All information provided is deemed reliable, but is not guaranteed to be accurate and should be independently verified.
![]() IDX information is provided exclusively for personal, non-commercial use, and may not be used for any purpose other than to identify prospective properties consumers may be interested in purchasing. Information is deemed reliable but not guaranteed.
IDX information is provided exclusively for personal, non-commercial use, and may not be used for any purpose other than to identify prospective properties consumers may be interested in purchasing. Information is deemed reliable but not guaranteed.
- 7355 Countryside Grove
- 10677 Traders Pkwy
- 10587 Country Park Point
- 7427 Middle Bay Way
- 10747 Hidden Prairie Pkwy
- 10797 Hidden Prairie Pkwy
- 10581 Traders Pkwy
- 10898 Hidden Prairie Pkwy
- 11081 Buckhead Place
- 10994 Tidal Run Cir
- 7275 Trione Ln
- 0 E Virginia Ave
- 212 S Reed St
- 204 S Reed St
- 7668 Benecia Dr
- 7568 Benecia Dr
- 10858 Traders Pkwy
- 119 & 121 E Ohio Ave
- 11426 Melden Way
- 508 E Ohio Ave
