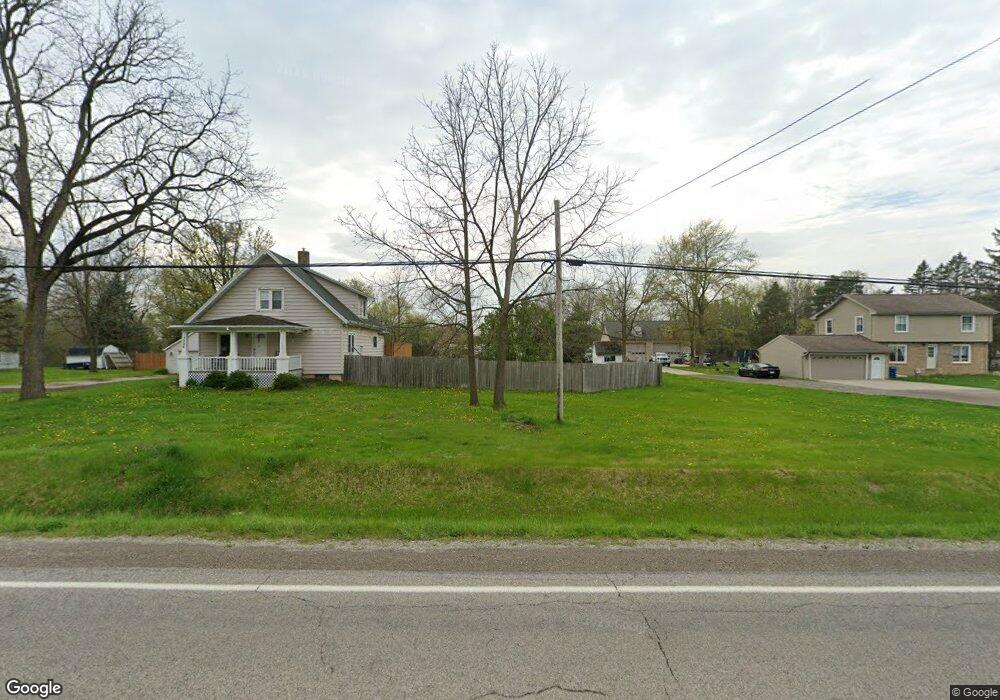
7394 Linden Rd Swartz Creek, MI 48473
Estimated Value: $169,000 - $353,000
3
Beds
3
Baths
1,524
Sq Ft
$163/Sq Ft
Est. Value
About This Home
This home is located at 7394 Linden Rd, Swartz Creek, MI 48473 and is currently estimated at $247,701, approximately $162 per square foot. 7394 Linden Rd is a home located in Genesee County with nearby schools including Elms Road Elementary School, Syring Elementary School, and Morrish Elementary School.
Ownership History
Date
Name
Owned For
Owner Type
Purchase Details
Closed on
Oct 3, 2019
Sold by
Barclae Dena Lee
Bought by
Barclae Dena Lee and Dena Lee Barclae Revocable Tru
Current Estimated Value
Purchase Details
Closed on
Sep 10, 2010
Sold by
Guzak Benjamin R and Guzak Mary
Bought by
Longworth Paul J
Purchase Details
Closed on
Nov 26, 2007
Sold by
Iron Workers Local 25 Pension Fund
Bought by
Guzak Benjamin R
Purchase Details
Closed on
Dec 14, 2006
Sold by
Aaa Mortgage Corp
Bought by
Iron Workers Local 25 Pension Fund
Purchase Details
Closed on
Nov 2, 2005
Sold by
Sanden Richard E and Sanden Jamie L
Bought by
Aaa Mortgage Corp
Create a Home Valuation Report for This Property
The Home Valuation Report is an in-depth analysis detailing your home's value as well as a comparison with similar homes in the area
Home Values in the Area
Average Home Value in this Area
Purchase History
| Date | Buyer | Sale Price | Title Company |
|---|---|---|---|
| Barclae Dena Lee | -- | None Available | |
| Longworth Paul J | $109,000 | First American Title Ins Co | |
| Guzak Benjamin R | $53,000 | Sargents Title Company | |
| Iron Workers Local 25 Pension Fund | -- | Sargents Title | |
| Aaa Mortgage Corp | $144,479 | None Available |
Source: Public Records
Tax History Compared to Growth
Tax History
| Year | Tax Paid | Tax Assessment Tax Assessment Total Assessment is a certain percentage of the fair market value that is determined by local assessors to be the total taxable value of land and additions on the property. | Land | Improvement |
|---|---|---|---|---|
| 2025 | $2,126 | $71,900 | $0 | $0 |
| 2024 | $1,236 | $68,900 | $0 | $0 |
| 2023 | $1,179 | $62,000 | $0 | $0 |
| 2022 | $1,867 | $58,600 | $0 | $0 |
| 2021 | $1,838 | $56,300 | $0 | $0 |
| 2020 | $1,088 | $54,300 | $0 | $0 |
| 2019 | $1,072 | $52,400 | $0 | $0 |
| 2018 | $1,507 | $51,600 | $0 | $0 |
| 2017 | $1,436 | $50,300 | $0 | $0 |
| 2016 | $1,422 | $48,000 | $0 | $0 |
| 2015 | $1,278 | $45,000 | $0 | $0 |
| 2014 | $819 | $43,300 | $0 | $0 |
| 2012 | -- | $40,700 | $40,700 | $0 |
Source: Public Records
Map
Nearby Homes
- 7465 Skylar Ct
- 7452 Skylar Ct
- 7499 Skylar Ct
- 7484 Skylar Ct
- 7494 Skylar Ct
- 0 Grand Blanc Rd Unit 50167168
- 4368 Regency Rd
- 0 Reid Rd Unit 50168280
- 4206 Grand Blanc Rd
- 5482 Grand Blanc Rd
- 4034 W Grand Blanc Rd
- VL Sharp Rd
- 3201 W Grand Blanc Rd
- 00 Grand Blanc Rd
- 5130 Highpoint Dr
- 5280 O Connor Pass
- 6285 Victoria Ln
- 6309 Victoria Ln
- 5220 Wyndemere Cir
- 3413 Reid Rd
- 7376 Linden Rd
- 7362 Linden Rd
- 7400 Linden Rd
- 7422 Linden Rd
- 7340 Linden Rd
- 7432 Linden Rd
- 7352 Linden Rd
- 7318 Linden Rd
- 7442 Linden Rd
- 5060 Grand Blanc Rd
- 7393 Linden Rd
- 7401 Linden Rd
- 7468 Linden Rd
- 5144 Walkabout Ln
- 7433 Linden Rd
- 7310 Linden Rd
- 7419 Linden Rd
- 7439 Linden Rd
- 7294 Linden Rd
- 7476 Linden Rd