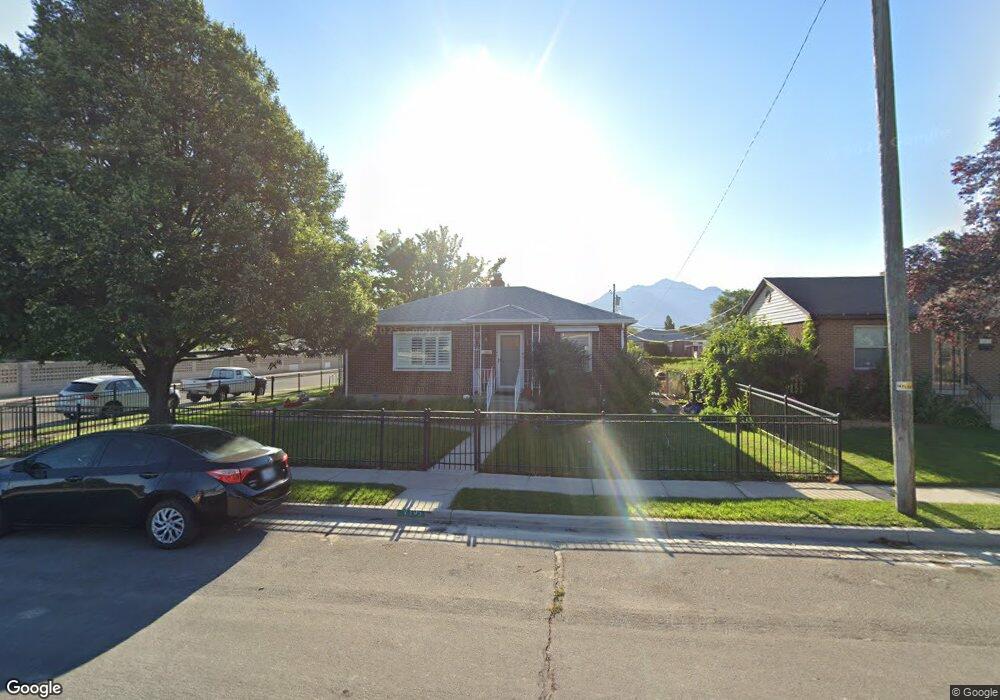
7395 S Spruce St Midvale, UT 84047
Estimated Value: $516,000 - $532,000
4
Beds
2
Baths
2,268
Sq Ft
$231/Sq Ft
Est. Value
About This Home
This home is located at 7395 S Spruce St, Midvale, UT 84047 and is currently estimated at $524,790, approximately $231 per square foot. 7395 S Spruce St is a home located in Salt Lake County with nearby schools including East Midvale Elementary School, Midvale Middle School, and Hillcrest High School.
Ownership History
Date
Name
Owned For
Owner Type
Purchase Details
Closed on
Jun 8, 2016
Sold by
Rozycki Ann C and Rozycki Ann
Bought by
Sosa Joseph G and Sosa Marie
Current Estimated Value
Home Financials for this Owner
Home Financials are based on the most recent Mortgage that was taken out on this home.
Original Mortgage
$49,000
Outstanding Balance
$38,999
Interest Rate
3.57%
Mortgage Type
Unknown
Estimated Equity
$485,791
Purchase Details
Closed on
Aug 29, 2002
Sold by
Budd Linda Jeanne
Bought by
Rozycki Ann C
Home Financials for this Owner
Home Financials are based on the most recent Mortgage that was taken out on this home.
Original Mortgage
$115,710
Interest Rate
6.43%
Mortgage Type
FHA
Purchase Details
Closed on
Aug 13, 1999
Sold by
Churich Mike and Churich Jeanne B
Bought by
Churich Mike and Churich Jeanne B
Create a Home Valuation Report for This Property
The Home Valuation Report is an in-depth analysis detailing your home's value as well as a comparison with similar homes in the area
Home Values in the Area
Average Home Value in this Area
Purchase History
| Date | Buyer | Sale Price | Title Company |
|---|---|---|---|
| Sosa Joseph G | -- | Us Title | |
| Rozycki Ann C | -- | Surety Title Agency Inc | |
| Churich Mike | -- | -- |
Source: Public Records
Mortgage History
| Date | Status | Borrower | Loan Amount |
|---|---|---|---|
| Open | Sosa Joseph G | $49,000 | |
| Open | Sosa Joseph G | $196,000 | |
| Previous Owner | Rozycki Ann C | $115,710 |
Source: Public Records
Tax History
| Year | Tax Paid | Tax Assessment Tax Assessment Total Assessment is a certain percentage of the fair market value that is determined by local assessors to be the total taxable value of land and additions on the property. | Land | Improvement |
|---|---|---|---|---|
| 2025 | $2,629 | $480,100 | $134,200 | $345,900 |
| 2024 | $2,629 | $448,400 | $127,500 | $320,900 |
| 2023 | $2,571 | $415,400 | $121,200 | $294,200 |
| 2022 | $2,571 | $425,300 | $118,800 | $306,500 |
| 2021 | $2,997 | $321,300 | $108,900 | $212,400 |
| 2020 | $2,153 | $289,500 | $79,200 | $210,300 |
| 2019 | $1,945 | $255,300 | $70,700 | $184,600 |
| 2018 | $0 | $248,800 | $70,700 | $178,100 |
| 2017 | $1,931 | $248,000 | $70,700 | $177,300 |
| 2016 | $1,500 | $187,000 | $70,700 | $116,300 |
| 2015 | $1,483 | $182,300 | $72,100 | $110,200 |
| 2014 | $1,448 | $174,000 | $70,000 | $104,000 |
Source: Public Records
Map
Nearby Homes
- 7346 S Sideline Ln Unit 44
- 7342 S Sideline Ln Unit 45
- 7340 S Sideline Ln Unit 46
- 7338 S Sideline Ln Unit 47
- 7343 S Sideline Ln Unit 49
- 7336 S Sideline Ln Unit 48
- 7341 S Sideline Ln Unit 50
- 7373 S Wood Lily Ct Unit 24
- 7339 S Sideline Ln Unit 51
- 7369 S Wood Lily Ct Unit 23
- 7332 S Sideline Ln Unit 53
- 7365 S Wood Lily Ct Unit 22
- 7337 S Sideline Ln Unit 52
- 7361 S Wood Lily Ct Unit 21
- 7330 S Sideline Ln Unit 54
- 7357 S Wood Lily Ct Unit 20
- 7353 S Wood Lily Ct Unit 19
- 7333 S Sideline Ln Unit 57
- 7328 S Sideline Ln Unit 55
- 7344 S Seven Tree Ln Unit 78
Your Personal Tour Guide
Ask me questions while you tour the home.