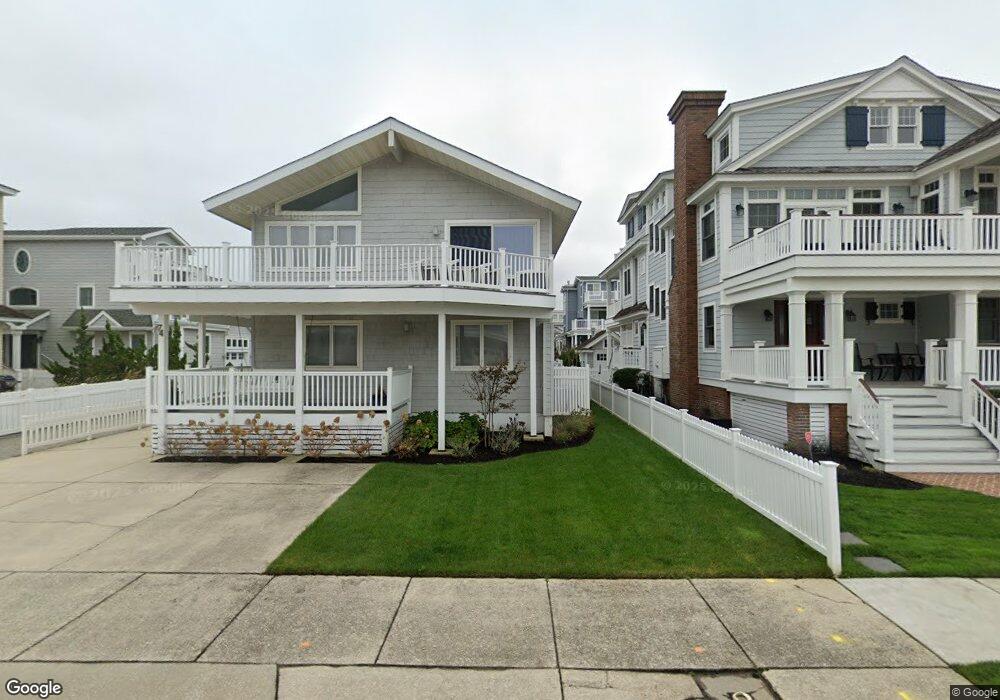
74 14th St E Avalon, NJ 08202
Estimated Value: $4,052,000 - $4,317,072
Studio
--
Bath
2,912
Sq Ft
$1,423/Sq Ft
Est. Value
About This Home
This home is located at 74 14th St E, Avalon, NJ 08202 and is currently estimated at $4,144,357, approximately $1,423 per square foot. 74 14th St E is a home located in Cape May County with nearby schools including Avalon Elementary School.
Ownership History
Date
Name
Owned For
Owner Type
Purchase Details
Closed on
Sep 19, 2012
Sold by
Batt Gregory J and Batt Carina
Bought by
Marss Property Management
Current Estimated Value
Home Financials for this Owner
Home Financials are based on the most recent Mortgage that was taken out on this home.
Original Mortgage
$1,500,000
Outstanding Balance
$1,076,227
Interest Rate
4.37%
Mortgage Type
New Conventional
Estimated Equity
$3,068,130
Purchase Details
Closed on
Jul 2, 2007
Sold by
Batt Gregory J
Bought by
Batt Gregory J and Batt Carina Wester
Home Financials for this Owner
Home Financials are based on the most recent Mortgage that was taken out on this home.
Original Mortgage
$252,500
Interest Rate
6.48%
Mortgage Type
Credit Line Revolving
Purchase Details
Closed on
Jun 21, 2007
Sold by
Batt Gregory J and Batt Carina
Bought by
Batt Gregory J
Home Financials for this Owner
Home Financials are based on the most recent Mortgage that was taken out on this home.
Original Mortgage
$252,500
Interest Rate
6.48%
Mortgage Type
Credit Line Revolving
Purchase Details
Closed on
Oct 20, 2004
Sold by
Decker Thomas A and Decker Candace
Bought by
Batt Gregory J and Batt Carina
Home Financials for this Owner
Home Financials are based on the most recent Mortgage that was taken out on this home.
Original Mortgage
$1,666,000
Interest Rate
1%
Mortgage Type
New Conventional
Purchase Details
Closed on
Oct 14, 2004
Sold by
Borough Of Avalon
Bought by
Decker Thomas A and Decker Candace
Home Financials for this Owner
Home Financials are based on the most recent Mortgage that was taken out on this home.
Original Mortgage
$1,666,000
Interest Rate
1%
Mortgage Type
New Conventional
Purchase Details
Closed on
Aug 29, 1998
Sold by
Finger Henry
Bought by
Mener Julia and Robinson Mark And Linda
Home Financials for this Owner
Home Financials are based on the most recent Mortgage that was taken out on this home.
Original Mortgage
$324,000
Interest Rate
6.9%
Purchase Details
Closed on
Aug 25, 1992
Sold by
Realty Exchange Services Inc
Bought by
Decker Thomas A
Create a Home Valuation Report for This Property
The Home Valuation Report is an in-depth analysis detailing your home's value as well as a comparison with similar homes in the area
Home Values in the Area
Average Home Value in this Area
Purchase History
| Date | Buyer | Sale Price | Title Company |
|---|---|---|---|
| Marss Property Management | $2,225,000 | None Available | |
| Batt Gregory J | -- | None Available | |
| Batt Gregory J | -- | None Available | |
| Batt Gregory J | $2,250,000 | -- | |
| Decker Thomas A | -- | -- | |
| Mener Julia | $405,000 | -- | |
| Decker Thomas A | -- | -- | |
| Realty Exchange Services Inc | $425,000 | -- |
Source: Public Records
Mortgage History
| Date | Status | Borrower | Loan Amount |
|---|---|---|---|
| Open | Marss Property Management | $1,500,000 | |
| Previous Owner | Batt Gregory J | $252,500 | |
| Previous Owner | Batt Gregory J | $1,500,000 | |
| Previous Owner | Batt Gregory J | $1,666,000 | |
| Previous Owner | Mener Julia | $324,000 |
Source: Public Records
Tax History
| Year | Tax Paid | Tax Assessment Tax Assessment Total Assessment is a certain percentage of the fair market value that is determined by local assessors to be the total taxable value of land and additions on the property. | Land | Improvement |
|---|---|---|---|---|
| 2025 | $13,901 | $2,264,000 | $2,000,000 | $264,000 |
| 2024 | $13,901 | $2,264,000 | $2,000,000 | $264,000 |
| 2023 | $13,788 | $2,264,000 | $2,000,000 | $264,000 |
| 2022 | $12,860 | $2,264,000 | $2,000,000 | $264,000 |
| 2021 | $12,191 | $2,264,000 | $2,000,000 | $264,000 |
| 2020 | $11,909 | $2,264,000 | $2,000,000 | $264,000 |
| 2019 | $11,546 | $2,264,000 | $2,000,000 | $264,000 |
| 2018 | $11,048 | $2,264,000 | $2,000,000 | $264,000 |
| 2017 | $10,508 | $1,890,000 | $1,600,000 | $290,000 |
| 2016 | $10,395 | $1,890,000 | $1,600,000 | $290,000 |
| 2015 | $10,225 | $1,890,000 | $1,600,000 | $290,000 |
| 2014 | $10,112 | $1,890,000 | $1,600,000 | $290,000 |
Source: Public Records
Map
Nearby Homes
Your Personal Tour Guide
Ask me questions while you tour the home.