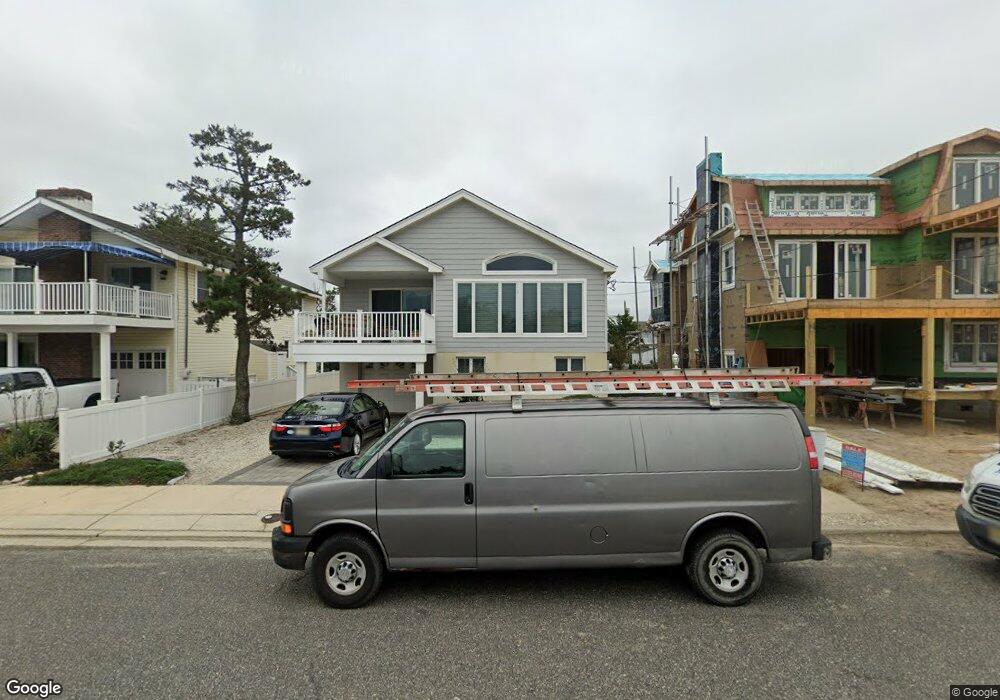
74 9th St E Avalon, NJ 08202
Estimated Value: $5,045,000 - $7,429,082
Studio
--
Bath
5,937
Sq Ft
$1,013/Sq Ft
Est. Value
About This Home
This home is located at 74 9th St E, Avalon, NJ 08202 and is currently estimated at $6,012,027, approximately $1,012 per square foot. 74 9th St E is a home located in Cape May County with nearby schools including Avalon Elementary School.
Ownership History
Date
Name
Owned For
Owner Type
Purchase Details
Closed on
Mar 31, 2020
Sold by
Bancrofy Philip
Bought by
Bancroft Phili
Current Estimated Value
Purchase Details
Closed on
Mar 29, 2018
Sold by
Toner Cary and Toner Mary A
Bought by
Bancroft Philip
Home Financials for this Owner
Home Financials are based on the most recent Mortgage that was taken out on this home.
Original Mortgage
$3,000,000
Interest Rate
3.8%
Mortgage Type
Purchase Money Mortgage
Purchase Details
Closed on
Nov 28, 2005
Sold by
Bender Thomas J and Bender Kathi L
Bought by
Toner Cary and Toner Mary Ann C
Home Financials for this Owner
Home Financials are based on the most recent Mortgage that was taken out on this home.
Original Mortgage
$200,000
Interest Rate
6.14%
Mortgage Type
Credit Line Revolving
Create a Home Valuation Report for This Property
The Home Valuation Report is an in-depth analysis detailing your home's value as well as a comparison with similar homes in the area
Home Values in the Area
Average Home Value in this Area
Purchase History
| Date | Buyer | Sale Price | Title Company |
|---|---|---|---|
| Bancroft Phili | -- | None Available | |
| Bancroft Philip | $8,625,000 | -- | |
| Toner Cary | $5,000,000 | Shore Title Agency Inc |
Source: Public Records
Mortgage History
| Date | Status | Borrower | Loan Amount |
|---|---|---|---|
| Previous Owner | Bancroft Philip | $3,000,000 | |
| Previous Owner | Toner Cary | $200,000 | |
| Previous Owner | Toner Cary | $3,000,000 |
Source: Public Records
Tax History
| Year | Tax Paid | Tax Assessment Tax Assessment Total Assessment is a certain percentage of the fair market value that is determined by local assessors to be the total taxable value of land and additions on the property. | Land | Improvement |
|---|---|---|---|---|
| 2025 | $53,503 | $8,713,800 | $6,100,000 | $2,613,800 |
| 2024 | $53,503 | $8,713,800 | $6,100,000 | $2,613,800 |
| 2023 | $53,067 | $8,713,800 | $6,100,000 | $2,613,800 |
| 2022 | $49,494 | $8,713,800 | $6,100,000 | $2,613,800 |
| 2021 | $47,664 | $8,713,800 | $6,100,000 | $2,613,800 |
| 2020 | $45,835 | $8,713,800 | $6,100,000 | $2,613,800 |
| 2019 | $44,148 | $8,656,400 | $6,100,000 | $2,556,400 |
| 2018 | $42,243 | $8,656,400 | $6,100,000 | $2,556,400 |
| 2017 | $29,826 | $5,364,300 | $3,550,000 | $1,814,300 |
| 2016 | $29,504 | $5,364,300 | $3,550,000 | $1,814,300 |
| 2015 | $29,021 | $5,364,300 | $3,550,000 | $1,814,300 |
| 2014 | $28,699 | $5,364,300 | $3,550,000 | $1,814,300 |
Source: Public Records
Map
Nearby Homes
Your Personal Tour Guide
Ask me questions while you tour the home.