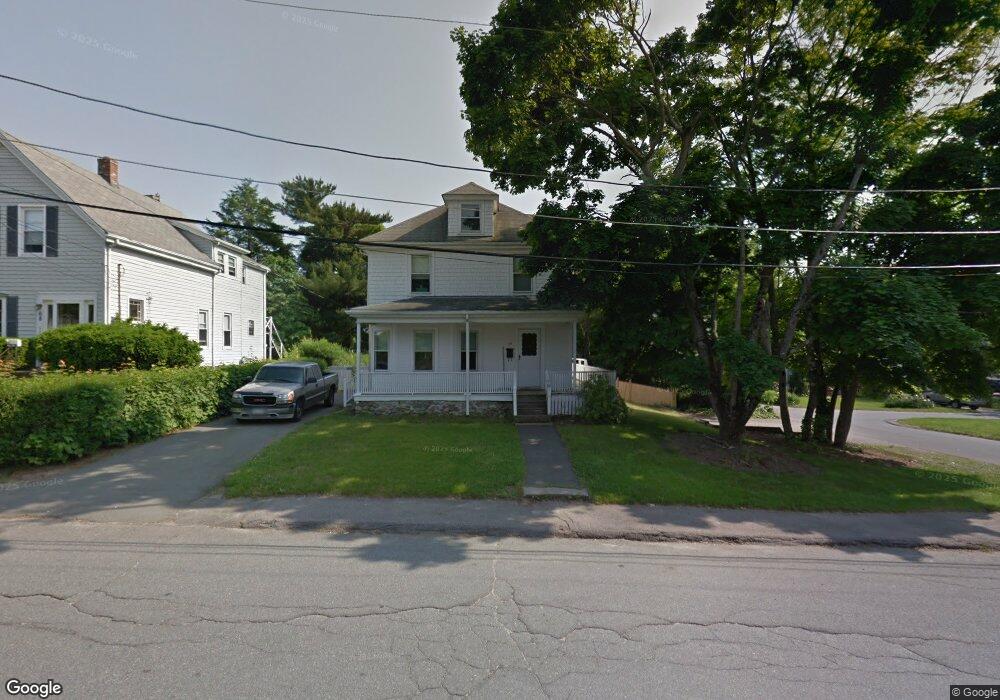
74 Adams St Holbrook, MA 02343
Estimated Value: $490,000 - $594,000
3
Beds
1
Bath
1,441
Sq Ft
$367/Sq Ft
Est. Value
About This Home
This home is located at 74 Adams St, Holbrook, MA 02343 and is currently estimated at $529,416, approximately $367 per square foot. 74 Adams St is a home located in Norfolk County with nearby schools including John F. Kennedy Elementary School, Holbrook Middle High School, and Boston Higashi School.
Ownership History
Date
Name
Owned For
Owner Type
Purchase Details
Closed on
Mar 15, 2007
Sold by
Illingworth Steven
Bought by
Obrien Colm and Obrien Mary
Current Estimated Value
Home Financials for this Owner
Home Financials are based on the most recent Mortgage that was taken out on this home.
Original Mortgage
$260,000
Outstanding Balance
$158,577
Interest Rate
6.4%
Mortgage Type
Purchase Money Mortgage
Estimated Equity
$370,839
Purchase Details
Closed on
May 13, 2003
Sold by
Illingworth John A and Illingworth Margaret M
Bought by
Illingworth Steven
Home Financials for this Owner
Home Financials are based on the most recent Mortgage that was taken out on this home.
Original Mortgage
$160,000
Interest Rate
5.93%
Mortgage Type
Purchase Money Mortgage
Create a Home Valuation Report for This Property
The Home Valuation Report is an in-depth analysis detailing your home's value as well as a comparison with similar homes in the area
Home Values in the Area
Average Home Value in this Area
Purchase History
| Date | Buyer | Sale Price | Title Company |
|---|---|---|---|
| Obrien Colm | $325,000 | -- | |
| Obrien Colm | $325,000 | -- | |
| Illingworth Steven | $200,000 | -- | |
| Illingworth Steven | $200,000 | -- |
Source: Public Records
Mortgage History
| Date | Status | Borrower | Loan Amount |
|---|---|---|---|
| Open | Obrien Colm | $260,000 | |
| Closed | Obrien Colm | $65,000 | |
| Closed | Illingworth Steven | $260,000 | |
| Previous Owner | Illingworth Steven | $160,000 |
Source: Public Records
Tax History
| Year | Tax Paid | Tax Assessment Tax Assessment Total Assessment is a certain percentage of the fair market value that is determined by local assessors to be the total taxable value of land and additions on the property. | Land | Improvement |
|---|---|---|---|---|
| 2025 | $57 | $431,400 | $217,000 | $214,400 |
| 2024 | $5,324 | $396,100 | $199,300 | $196,800 |
| 2023 | $5,563 | $361,700 | $175,600 | $186,100 |
| 2022 | $5,295 | $321,100 | $157,000 | $164,100 |
| 2021 | $5,120 | $297,300 | $142,700 | $154,600 |
| 2020 | $5,276 | $287,200 | $138,600 | $148,600 |
| 2019 | $5,375 | $276,200 | $131,900 | $144,300 |
| 2018 | $5,236 | $253,300 | $113,800 | $139,500 |
| 2017 | $4,920 | $235,400 | $103,800 | $131,600 |
| 2016 | $4,354 | $221,700 | $100,800 | $120,900 |
| 2015 | $4,024 | $210,900 | $94,800 | $116,100 |
| 2014 | $3,677 | $195,900 | $79,800 | $116,100 |
Source: Public Records
Map
Nearby Homes
- 181 S Franklin St Unit 102
- 27 Morgan Rd
- 7 Platts St
- 32 Elm Ave
- 5 Clarendon Cir Unit Lot 4
- 9 Sunset Ave
- 342 Plymouth St
- 38 Marion St
- 25 Lakeview Ave
- 595 South St
- 21 Dale Rd
- 38 Druid Hill Ave E
- 640 Plymouth St
- 45 Ernest St
- 117 Pine St
- 52 Quincy St
- 288 Weymouth St
- 38 Roosevelt St
- 5 Keystone Rd
- 14 Medallion Rd
Your Personal Tour Guide
Ask me questions while you tour the home.