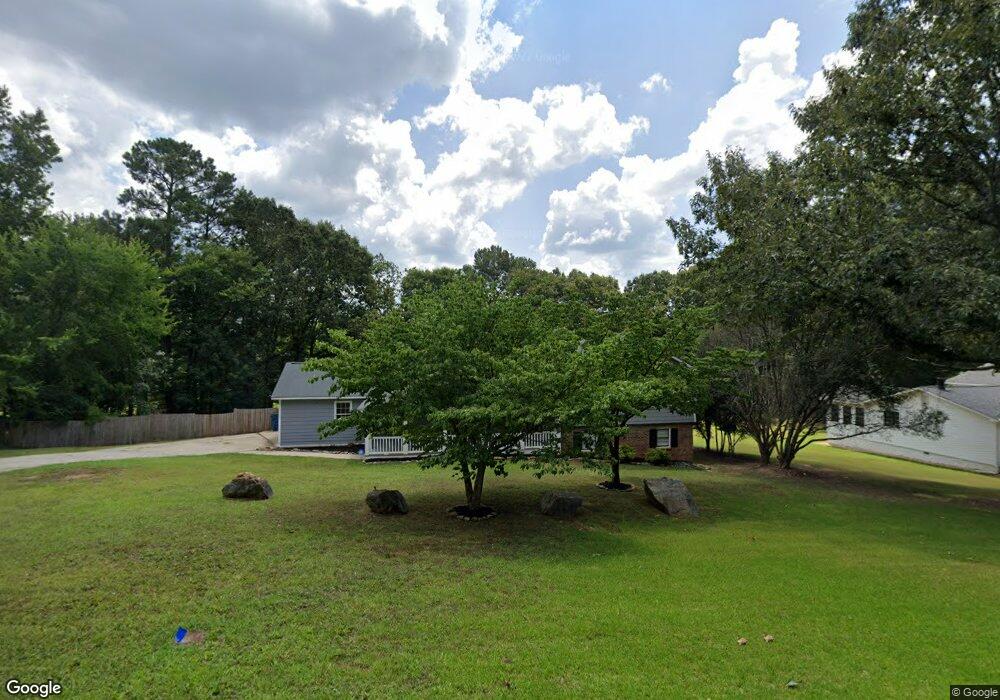
74 Amberidge Dr NW Unit 37 Cartersville, GA 30121
Estimated Value: $343,000 - $365,000
3
Beds
2
Baths
1,524
Sq Ft
$230/Sq Ft
Est. Value
About This Home
This home is located at 74 Amberidge Dr NW Unit 37, Cartersville, GA 30121 and is currently estimated at $350,757, approximately $230 per square foot. 74 Amberidge Dr NW Unit 37 is a home located in Bartow County with nearby schools including Kingston Elementary School, Cass Middle School, and Cass High School.
Ownership History
Date
Name
Owned For
Owner Type
Purchase Details
Closed on
Dec 14, 2021
Sold by
Kremer Mark
Bought by
Finkley Tyler D
Current Estimated Value
Home Financials for this Owner
Home Financials are based on the most recent Mortgage that was taken out on this home.
Original Mortgage
$302,421
Outstanding Balance
$278,148
Interest Rate
3.11%
Mortgage Type
FHA
Estimated Equity
$72,609
Purchase Details
Closed on
Dec 24, 2013
Sold by
Kremer Myrna S
Bought by
Kremer Mark S
Purchase Details
Closed on
Mar 1, 2012
Bought by
Kremer Myrna
Purchase Details
Closed on
Sep 6, 2011
Purchase Details
Closed on
Apr 24, 2008
Sold by
Matula Thomas
Bought by
King Lori
Home Financials for this Owner
Home Financials are based on the most recent Mortgage that was taken out on this home.
Original Mortgage
$94,024
Interest Rate
5.82%
Mortgage Type
FHA
Create a Home Valuation Report for This Property
The Home Valuation Report is an in-depth analysis detailing your home's value as well as a comparison with similar homes in the area
Home Values in the Area
Average Home Value in this Area
Purchase History
| Date | Buyer | Sale Price | Title Company |
|---|---|---|---|
| Finkley Tyler D | $308,000 | -- | |
| Kremer Mark S | -- | -- | |
| Kremer Mark S | -- | -- | |
| Kremer Myrna | $35,100 | -- | |
| Kremer Myrna | $35,100 | -- | |
| -- | $93,262 | -- | |
| -- | $32,000 | -- | |
| Jpmorgan Chase Bank National A | $32,000 | -- | |
| King Lori | $95,500 | -- |
Source: Public Records
Mortgage History
| Date | Status | Borrower | Loan Amount |
|---|---|---|---|
| Open | Finkley Tyler D | $302,421 | |
| Previous Owner | King Lori | $94,024 |
Source: Public Records
Tax History Compared to Growth
Tax History
| Year | Tax Paid | Tax Assessment Tax Assessment Total Assessment is a certain percentage of the fair market value that is determined by local assessors to be the total taxable value of land and additions on the property. | Land | Improvement |
|---|---|---|---|---|
| 2024 | $2,881 | $124,955 | $24,000 | $100,955 |
| 2023 | $2,881 | $124,170 | $22,600 | $101,570 |
| 2022 | $2,520 | $105,823 | $18,000 | $87,823 |
| 2021 | $1,518 | $56,887 | $18,000 | $38,887 |
| 2020 | $1,462 | $53,224 | $16,000 | $37,224 |
| 2019 | $1,382 | $49,788 | $12,000 | $37,788 |
| 2018 | $1,363 | $48,929 | $12,000 | $36,929 |
| 2017 | $1,206 | $43,080 | $12,000 | $31,080 |
| 2016 | $1,215 | $43,080 | $12,000 | $31,080 |
| 2015 | $1,217 | $43,080 | $12,000 | $31,080 |
| 2014 | -- | $32,080 | $6,000 | $26,080 |
| 2013 | -- | $14,040 | $8,000 | $6,040 |
Source: Public Records
Map
Nearby Homes
- 30 Amberidge Dr NW
- 104 Amberidge Dr NW
- 109 Amberidge Dr NW
- 40 Bishop Mill Dr NW
- 383 Oakridge Dr SE
- 354 Oakridge Dr SE
- 70 Baker Rd SE
- 4 Shallowood Place
- 602 Grassdale Rd
- 15 Home Place Dr
- 11 Meadow View Cir
- 0 Rudy York Rd NW Unit 10536144
- 00 Rudy York Rd NW
- 125 Evergreen Trail SE
- 104 Gilreath Rd SE
- 217 Eva Way NE
- 36 Live Oak Run NW
- 1771 Joe Frank Harris Pkwy SE
- 74 Amberidge Dr NW
- 64 Amberidge Dr NW
- 25 Bishop Mill Dr NW
- 21 Bishop Mill Dr NW
- 27 Bishop Mill Dr NW
- 90 Amberidge Dr NW
- 54 Amberidge Dr NW
- 0 Bishop Mill Dr NW Unit 7109040
- 0 Bishop Mill Dr NW Unit 7088818
- 0 Bishop Mill Dr NW Unit 7051950
- 0 Bishop Mill Dr NW Unit 8790420
- 0 Bishop Mill Dr NW Unit 8744709
- 0 Bishop Mill Dr NW Unit 8651989
- 0 Bishop Mill Dr NW Unit 8557757
- 0 Bishop Mill Dr NW Unit 8530909
- 0 Bishop Mill Dr Unit 8510672
- 0 Bishop Mill Dr Unit 8465603
- 0 Bishop Mill Dr NW Unit 8399069
- 0 Bishop Mill Dr NW Unit 8356495
- 0 Bishop Mill Dr NW Unit 8140291