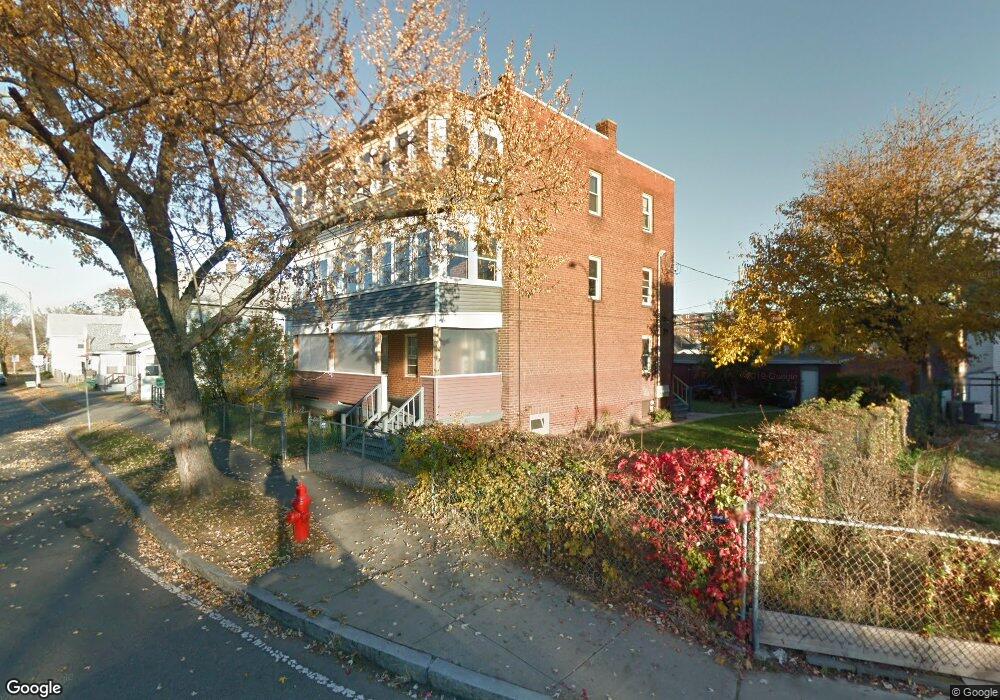
74 Beech St Unit 2ND Holyoke, MA 01040
Estimated Value: $277,847 - $431,000
6
Beds
3
Baths
3,168
Sq Ft
$112/Sq Ft
Est. Value
About This Home
This home is located at 74 Beech St Unit 2ND, Holyoke, MA 01040 and is currently estimated at $354,712, approximately $111 per square foot. 74 Beech St Unit 2ND is a home located in Hampden County with nearby schools including Kelly Elementary School, Lt. Clayre Sullivan Elementary School, and Holyoke High School.
Ownership History
Date
Name
Owned For
Owner Type
Purchase Details
Closed on
Jun 24, 1999
Sold by
Mysliewiec Lewis and Mysliewiec Mary
Bought by
Castillo Esteban and Castillo Luz M
Current Estimated Value
Home Financials for this Owner
Home Financials are based on the most recent Mortgage that was taken out on this home.
Original Mortgage
$85,500
Outstanding Balance
$22,623
Interest Rate
7.09%
Mortgage Type
Purchase Money Mortgage
Estimated Equity
$332,089
Create a Home Valuation Report for This Property
The Home Valuation Report is an in-depth analysis detailing your home's value as well as a comparison with similar homes in the area
Home Values in the Area
Average Home Value in this Area
Purchase History
| Date | Buyer | Sale Price | Title Company |
|---|---|---|---|
| Castillo Esteban | $86,000 | -- |
Source: Public Records
Mortgage History
| Date | Status | Borrower | Loan Amount |
|---|---|---|---|
| Open | Castillo Esteban | $25,000 | |
| Open | Castillo Esteban | $85,500 |
Source: Public Records
Tax History
| Year | Tax Paid | Tax Assessment Tax Assessment Total Assessment is a certain percentage of the fair market value that is determined by local assessors to be the total taxable value of land and additions on the property. | Land | Improvement |
|---|---|---|---|---|
| 2025 | $4,889 | $280,000 | $36,500 | $243,500 |
| 2024 | $4,705 | $248,300 | $34,700 | $213,600 |
| 2023 | $4,658 | $248,300 | $34,700 | $213,600 |
| 2022 | $4,674 | $242,700 | $34,700 | $208,000 |
| 2021 | $4,108 | $213,200 | $32,600 | $180,600 |
| 2020 | $3,871 | $202,900 | $32,600 | $170,300 |
| 2019 | $3,590 | $186,100 | $29,100 | $157,000 |
| 2018 | $3,459 | $180,800 | $29,100 | $151,700 |
| 2017 | $3,466 | $180,800 | $29,100 | $151,700 |
| 2016 | $3,300 | $172,600 | $27,600 | $145,000 |
| 2015 | $3,286 | $172,600 | $27,600 | $145,000 |
Source: Public Records
Map
Nearby Homes
- 63 Pine St
- 219 Suffolk St
- 15-17 Oconnor Ave
- 1137 Dwight St Unit C
- 215 Elm St
- 225 Beech St Unit 227
- 391 Pleasant St
- 352 Pleasant St
- 72 Allyn St
- 11 Hampshire St
- 301-303 Linden St
- 47 N Canal St
- 329 Beech St
- 76 Nonotuck St
- 104 Lincoln St
- 13-15 Pearl St
- 35 Carew St
- 50 Nonotuck St
- 41 Lynwood Ave
- 43 W Summit St Unit A10
Your Personal Tour Guide
Ask me questions while you tour the home.