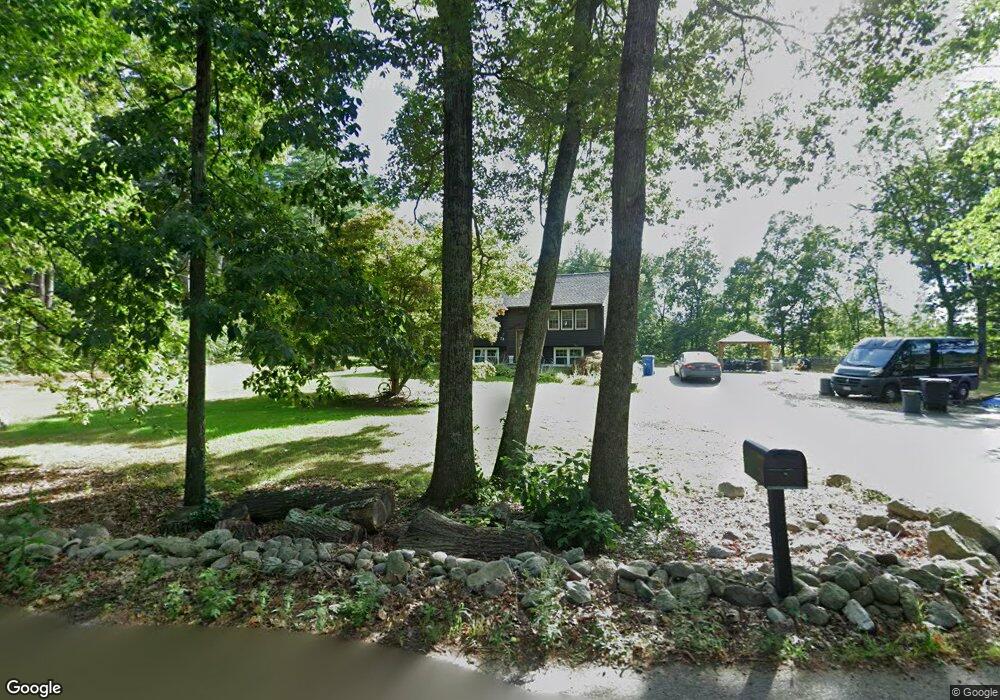
74 Berry St Wrentham, MA 02093
Estimated Value: $503,000 - $667,000
3
Beds
2
Baths
1,092
Sq Ft
$531/Sq Ft
Est. Value
About This Home
This home is located at 74 Berry St, Wrentham, MA 02093 and is currently estimated at $580,107, approximately $531 per square foot. 74 Berry St is a home located in Norfolk County with nearby schools including Delaney Elementary School, Charles E Roderick, and Discovery Daycare Center.
Ownership History
Date
Name
Owned For
Owner Type
Purchase Details
Closed on
Dec 28, 2017
Sold by
Johnson Stacie L and Johnson Gerald M
Bought by
Johnson Stacie L and Johnson Gerald M
Current Estimated Value
Purchase Details
Closed on
Aug 21, 2017
Sold by
Johnson Stacie L
Bought by
Johnson Stacie L and Johnson Gerald M
Purchase Details
Closed on
Jun 4, 2013
Sold by
Oconnell Sylvia F
Bought by
Oconnell Sylvia F and Thompson Stacie L
Purchase Details
Closed on
Dec 20, 2010
Sold by
Oconnell Francis P and Oconnell Sylvia F
Bought by
Oconnell Sylvia F
Purchase Details
Closed on
Dec 18, 1970
Bought by
Thompson Stacie L
Create a Home Valuation Report for This Property
The Home Valuation Report is an in-depth analysis detailing your home's value as well as a comparison with similar homes in the area
Purchase History
| Date | Buyer | Sale Price | Title Company |
|---|---|---|---|
| Johnson Stacie L | -- | -- | |
| Johnson Stacie L | -- | -- | |
| Oconnell Sylvia F | -- | -- | |
| Oconnell Sylvia F | -- | -- | |
| Thompson Stacie L | -- | -- |
Source: Public Records
Tax History
| Year | Tax Paid | Tax Assessment Tax Assessment Total Assessment is a certain percentage of the fair market value that is determined by local assessors to be the total taxable value of land and additions on the property. | Land | Improvement |
|---|---|---|---|---|
| 2025 | $6,135 | $529,300 | $288,000 | $241,300 |
| 2024 | $5,780 | $481,700 | $288,000 | $193,700 |
| 2023 | $5,486 | $434,700 | $261,900 | $172,800 |
| 2022 | $5,571 | $407,500 | $255,100 | $152,400 |
| 2021 | $4,958 | $352,400 | $238,400 | $114,000 |
| 2020 | $4,960 | $348,100 | $182,000 | $166,100 |
| 2019 | $4,510 | $319,400 | $163,800 | $155,600 |
| 2018 | $4,269 | $299,800 | $155,500 | $144,300 |
| 2017 | $4,037 | $283,300 | $152,500 | $130,800 |
| 2016 | $3,947 | $276,400 | $148,100 | $128,300 |
| 2015 | $3,820 | $255,000 | $142,300 | $112,700 |
| 2014 | $3,779 | $246,800 | $136,900 | $109,900 |
Source: Public Records
Map
Nearby Homes
- 1222 South St
- 165 Wampum St
- 23 Horseshoe Dr
- 440 South St
- 0 Berry St
- 18 Huntington Ave
- 613 West St
- 1 Chestnut St
- 10 Earle Stewart Ln Unit Lot 5
- 19 Chestnut St Lot 2
- 19 Chestnut St Lot 3
- 3 Earle Stewart Ln
- 12 Earle Stewart Ln
- 2 Earle Stewart Ln
- 20 Field Cir
- 440 Chestnut St
- 135 Creek St Unit 2
- 11 Amber Dr
- 158 Washington St
- 126 Washington St
Your Personal Tour Guide
Ask me questions while you tour the home.